

Designing a Platform for Monitoring and Optimizing Industrial Energy Networks
A look at the UX process and key decisions and tradeoffs behind designing an industrial steam monitoring and energy optimization platform for a global industrial company. The case study explores aligning the visualization with operators’ mental models, translating operational logic into clear interactions, and designing amid evolving requirements and limited direct user access.
Note: No confidential company data, operational configurations, or proprietary materials are disclosed in this case study. All site names, values, processes, and visuals were replaced, simplified, or recreated solely to demonstrate the design approach and interaction model. The examples are illustrative and do not represent the client’s actual operations.
Business Context & Problem
Some chemical substances produce heat when they’re combined with others. These are known as exothermic reactions. In large-scale chemical operations, the amount of generated heat becomes so significant that it turns into a valuable source of reusable energy. Instead of letting that energy go to waste, many companies convert this heat into high-pressure steam and redistribute it across their sites to either generate electricity or support other operations. This process often becomes highly interconnected and constraint-heavy. Steam continuously moves across multiple sites, gets transformed into different pressure levels depending on operational needs, and must satisfy changing production demands, equipment limitations, and process priorities. A single decision in one part of the network can directly impact energy efficiency, production continuity, and electricity generation across the entire operation.
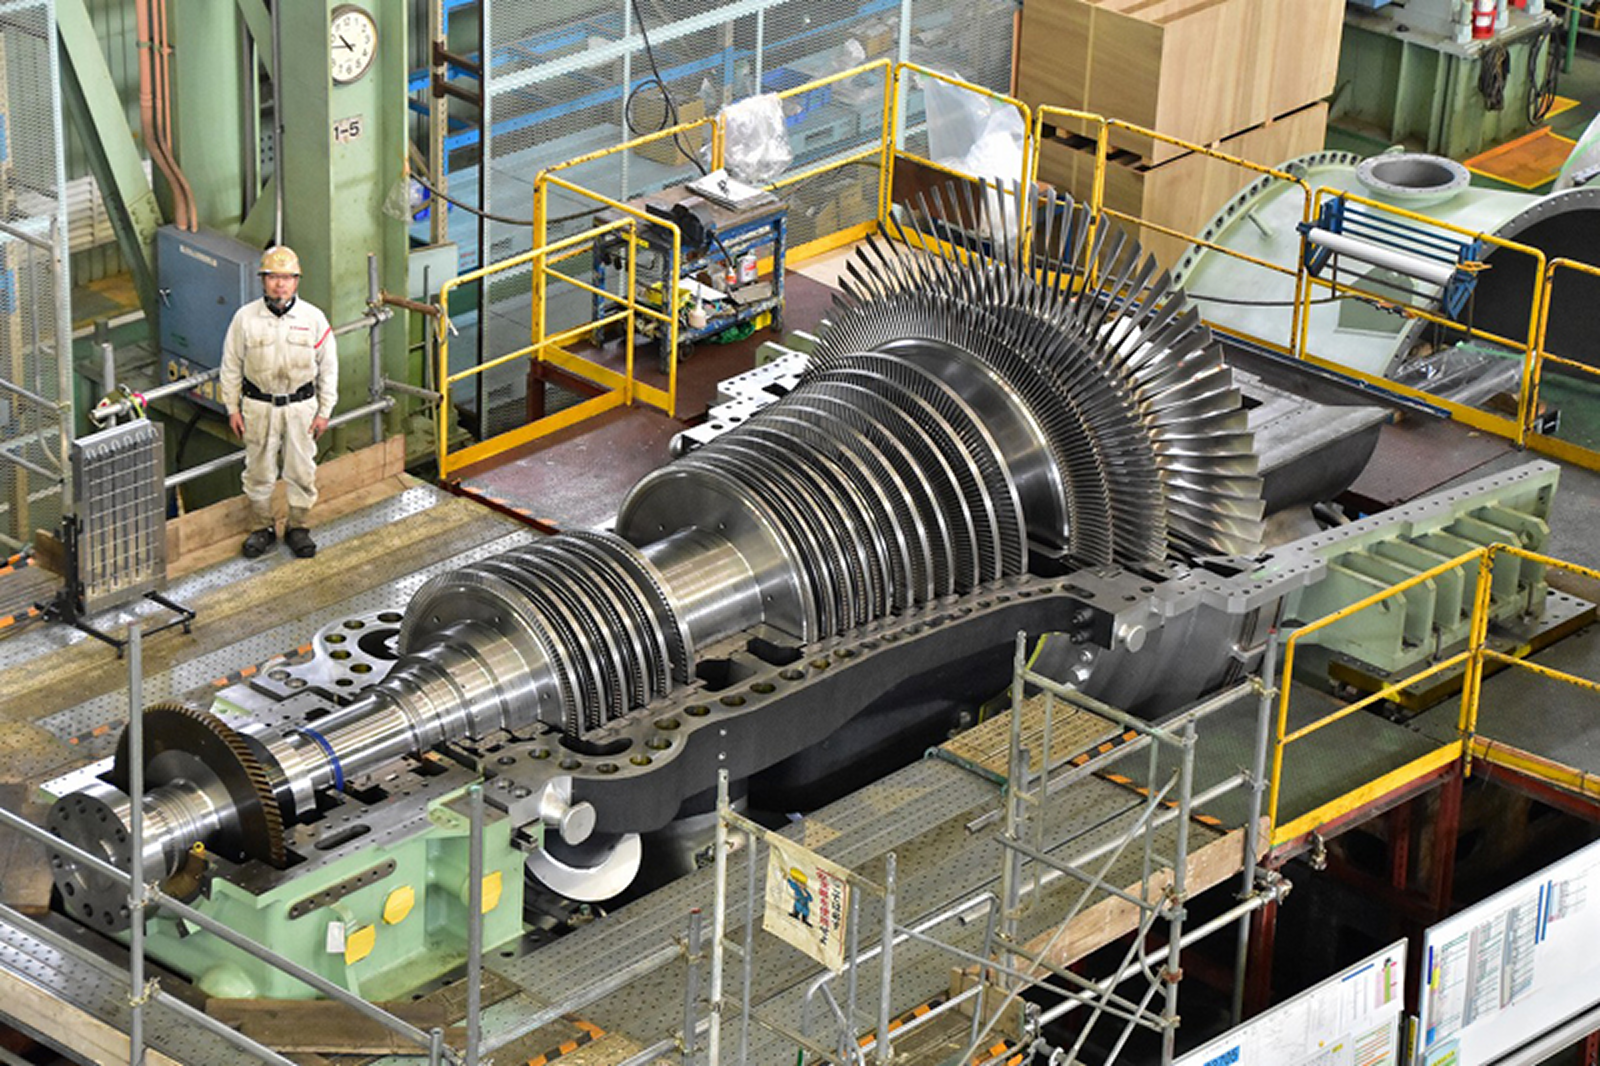
The steam network for a large industrial client was spread across multiple production sites with similar pipelines but different operational conditions and production needs. Operators & managers constantly had to decide how high-pressure steam should be distributed: whether it should pass through turbines to generate electricity or be redirected into other production processes requiring medium- or low-pressure steam. These decisions were handled manually using spreadsheets, fragmented monitoring tools, and human coordination to estimate the best operational configuration and react to changing production conditions. The process lacked a centralized way to visualize the network, understand the impact of each decision, or compare operational tradeoffs across the system.
Solution & Impact
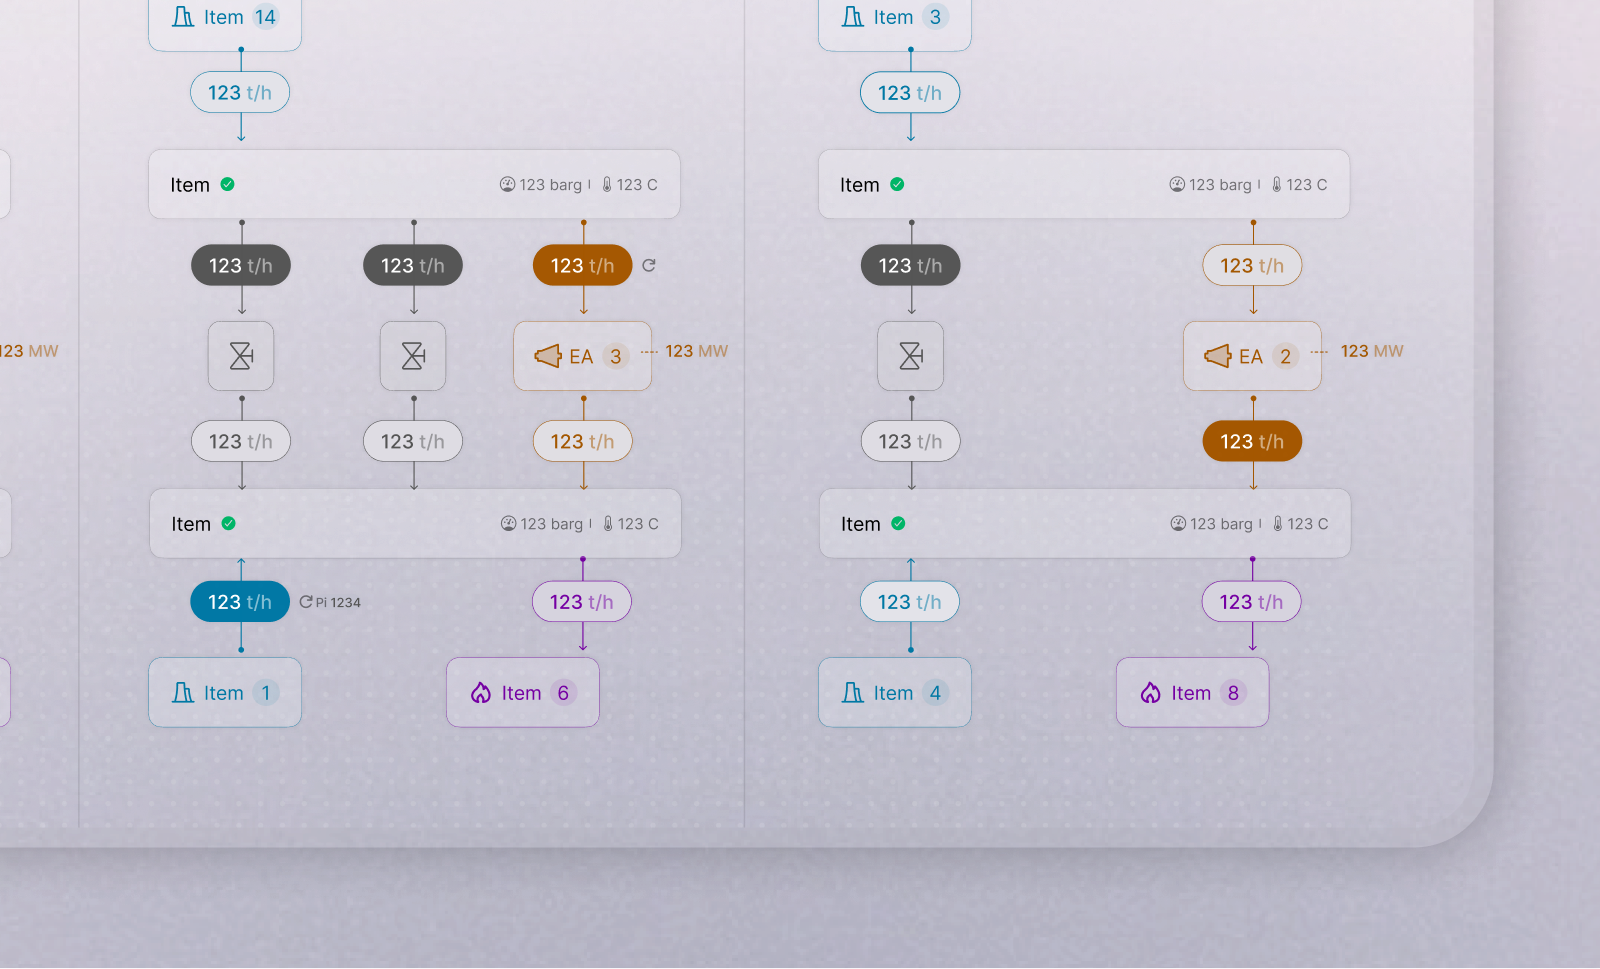
The platform combines a shared visualization of the steam network with optimization models that evaluate how energy should be distributed across sites. It helps teams identify configurations that satisfy changing production demands while directing excess steam through turbines to generate electricity whenever possible, rather than dissipating that energy through valves. This is difficult to optimize reliably through manual judgment alone because every decision depends on numerous interconnected variables, equipment constraints, and operational priorities. The platform presents recommended configurations while allowing operators to follow or override them based on operational context. Its reporting tools can then compare actual performance with the recommended scenario, helping teams understand how much energy and financial value was captured or potentially lost. At the company’s operational scale, even small efficiency improvements could translate into substantial savings.
The platform is currently rolling out and has received positive stakeholder feedback. No measured operational results are available yet; its impact on energy efficiency and financial performance will be assessed after sustained use.
Decisions & Iterations
The project began while the requirements and the team’s understanding of the operational process were still evolving, with new constraints emerging as work progressed. Rather than designing around a stable system, the interface evolved as we progressively understood how the process worked in practice. Two early directions I designed were ultimately set aside because they represented the system in ways that did not fully match how operators understood the network or prioritized operational decisions.
Preserving operational familiarity
My first approach focused on creating a clean and structured representation of the steam network based on process logic and energy-flow direction. Since I initially had limited access to the real operational process, I independently researched similar industrial systems and organized the layout around the system architecture itself. Although the structure was technically coherent, reviews revealed that its visual hierarchy communicated the wrong operational priorities. Collectors became the most visually dominant elements, while turbines and generated energy, the parts operators cared about most, felt secondary and visually compressed. The interface also used shades of blue to distinguish steam-pressure levels, which unintentionally made the network resemble a water system rather than a steam network.
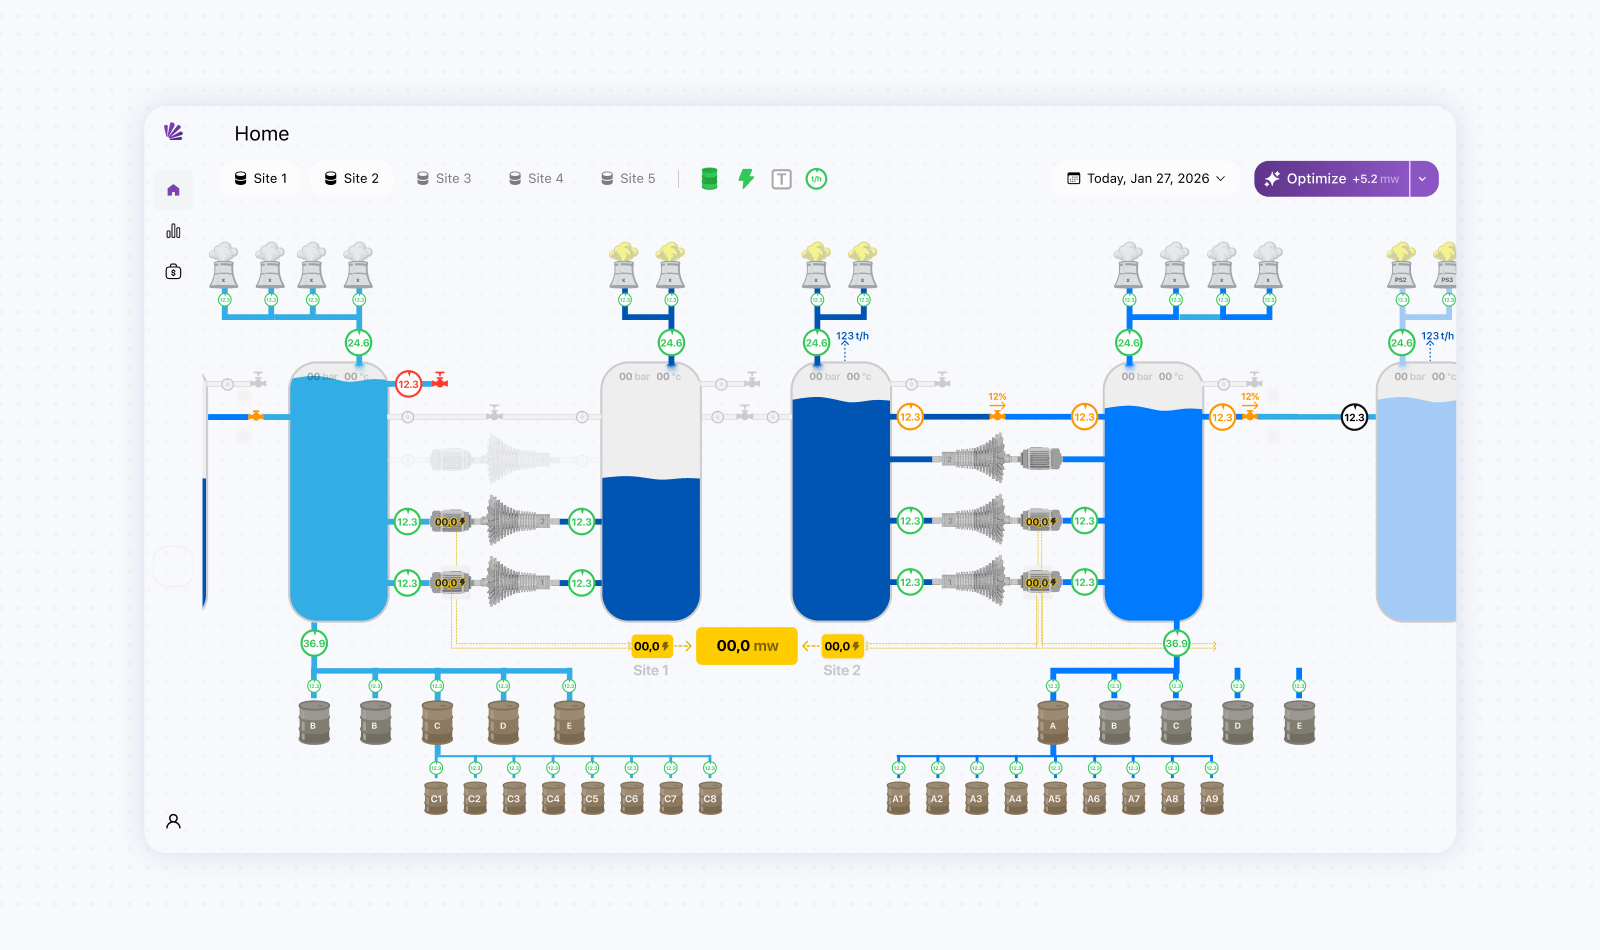
By that point, the direction had already gone through multiple rounds of refinement and interactive prototyping. In a more conventional design process, the underlying representation model would ideally have been validated with operators through wireframes before moving into detailed visual refinement. In this project, however, the compressed timeline and limited direct user access meant that validation and refinement often happened in parallel. As with several other complex B2B projects in my portfolio, higher-fidelity prototypes were necessary to make the operational concepts concrete enough for stakeholders to evaluate and discuss. Although stakeholders already had existing industrial diagrams, I initially treated them as references rather than established mental models operators regularly used. As the project progressed, it became clear that the directional structure of these diagrams carried important operational familiarity. The challenge therefore shifted from reinventing the representation to improving its readability, layout, iconography, and interaction clarity while preserving the logic operators already understood. Although setting aside a refined direction was costly, the prototypes also functioned as research artifacts. They helped build a shared understanding of the system, surface hidden assumptions, and progressively align the interface with the operational reality.
Structuring company-level & site-level views
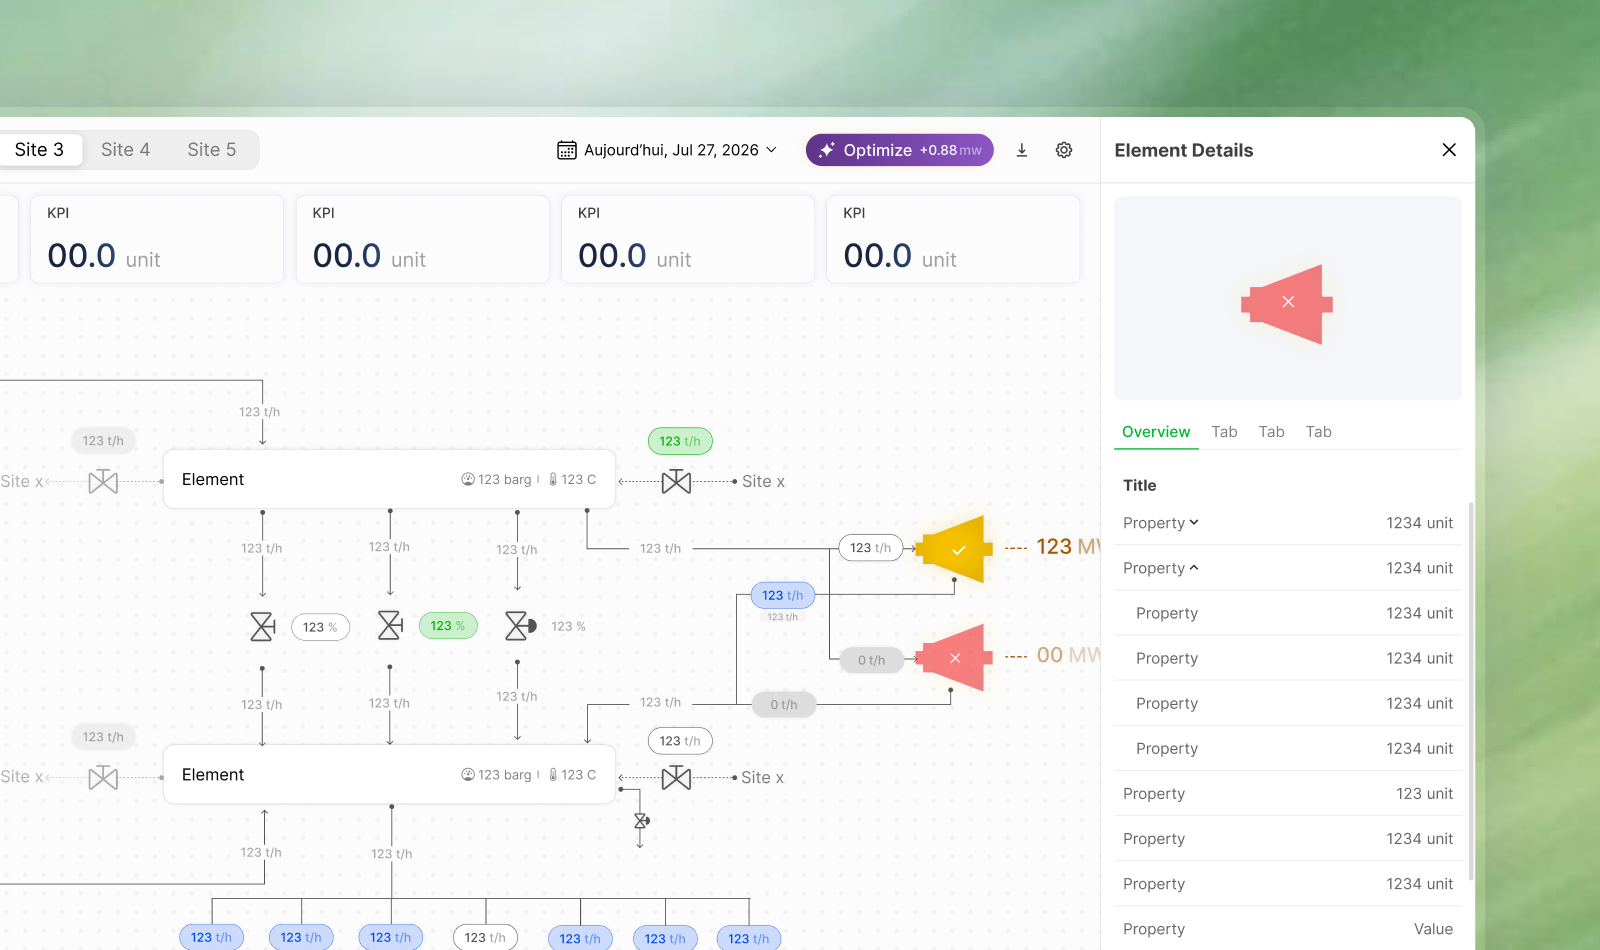
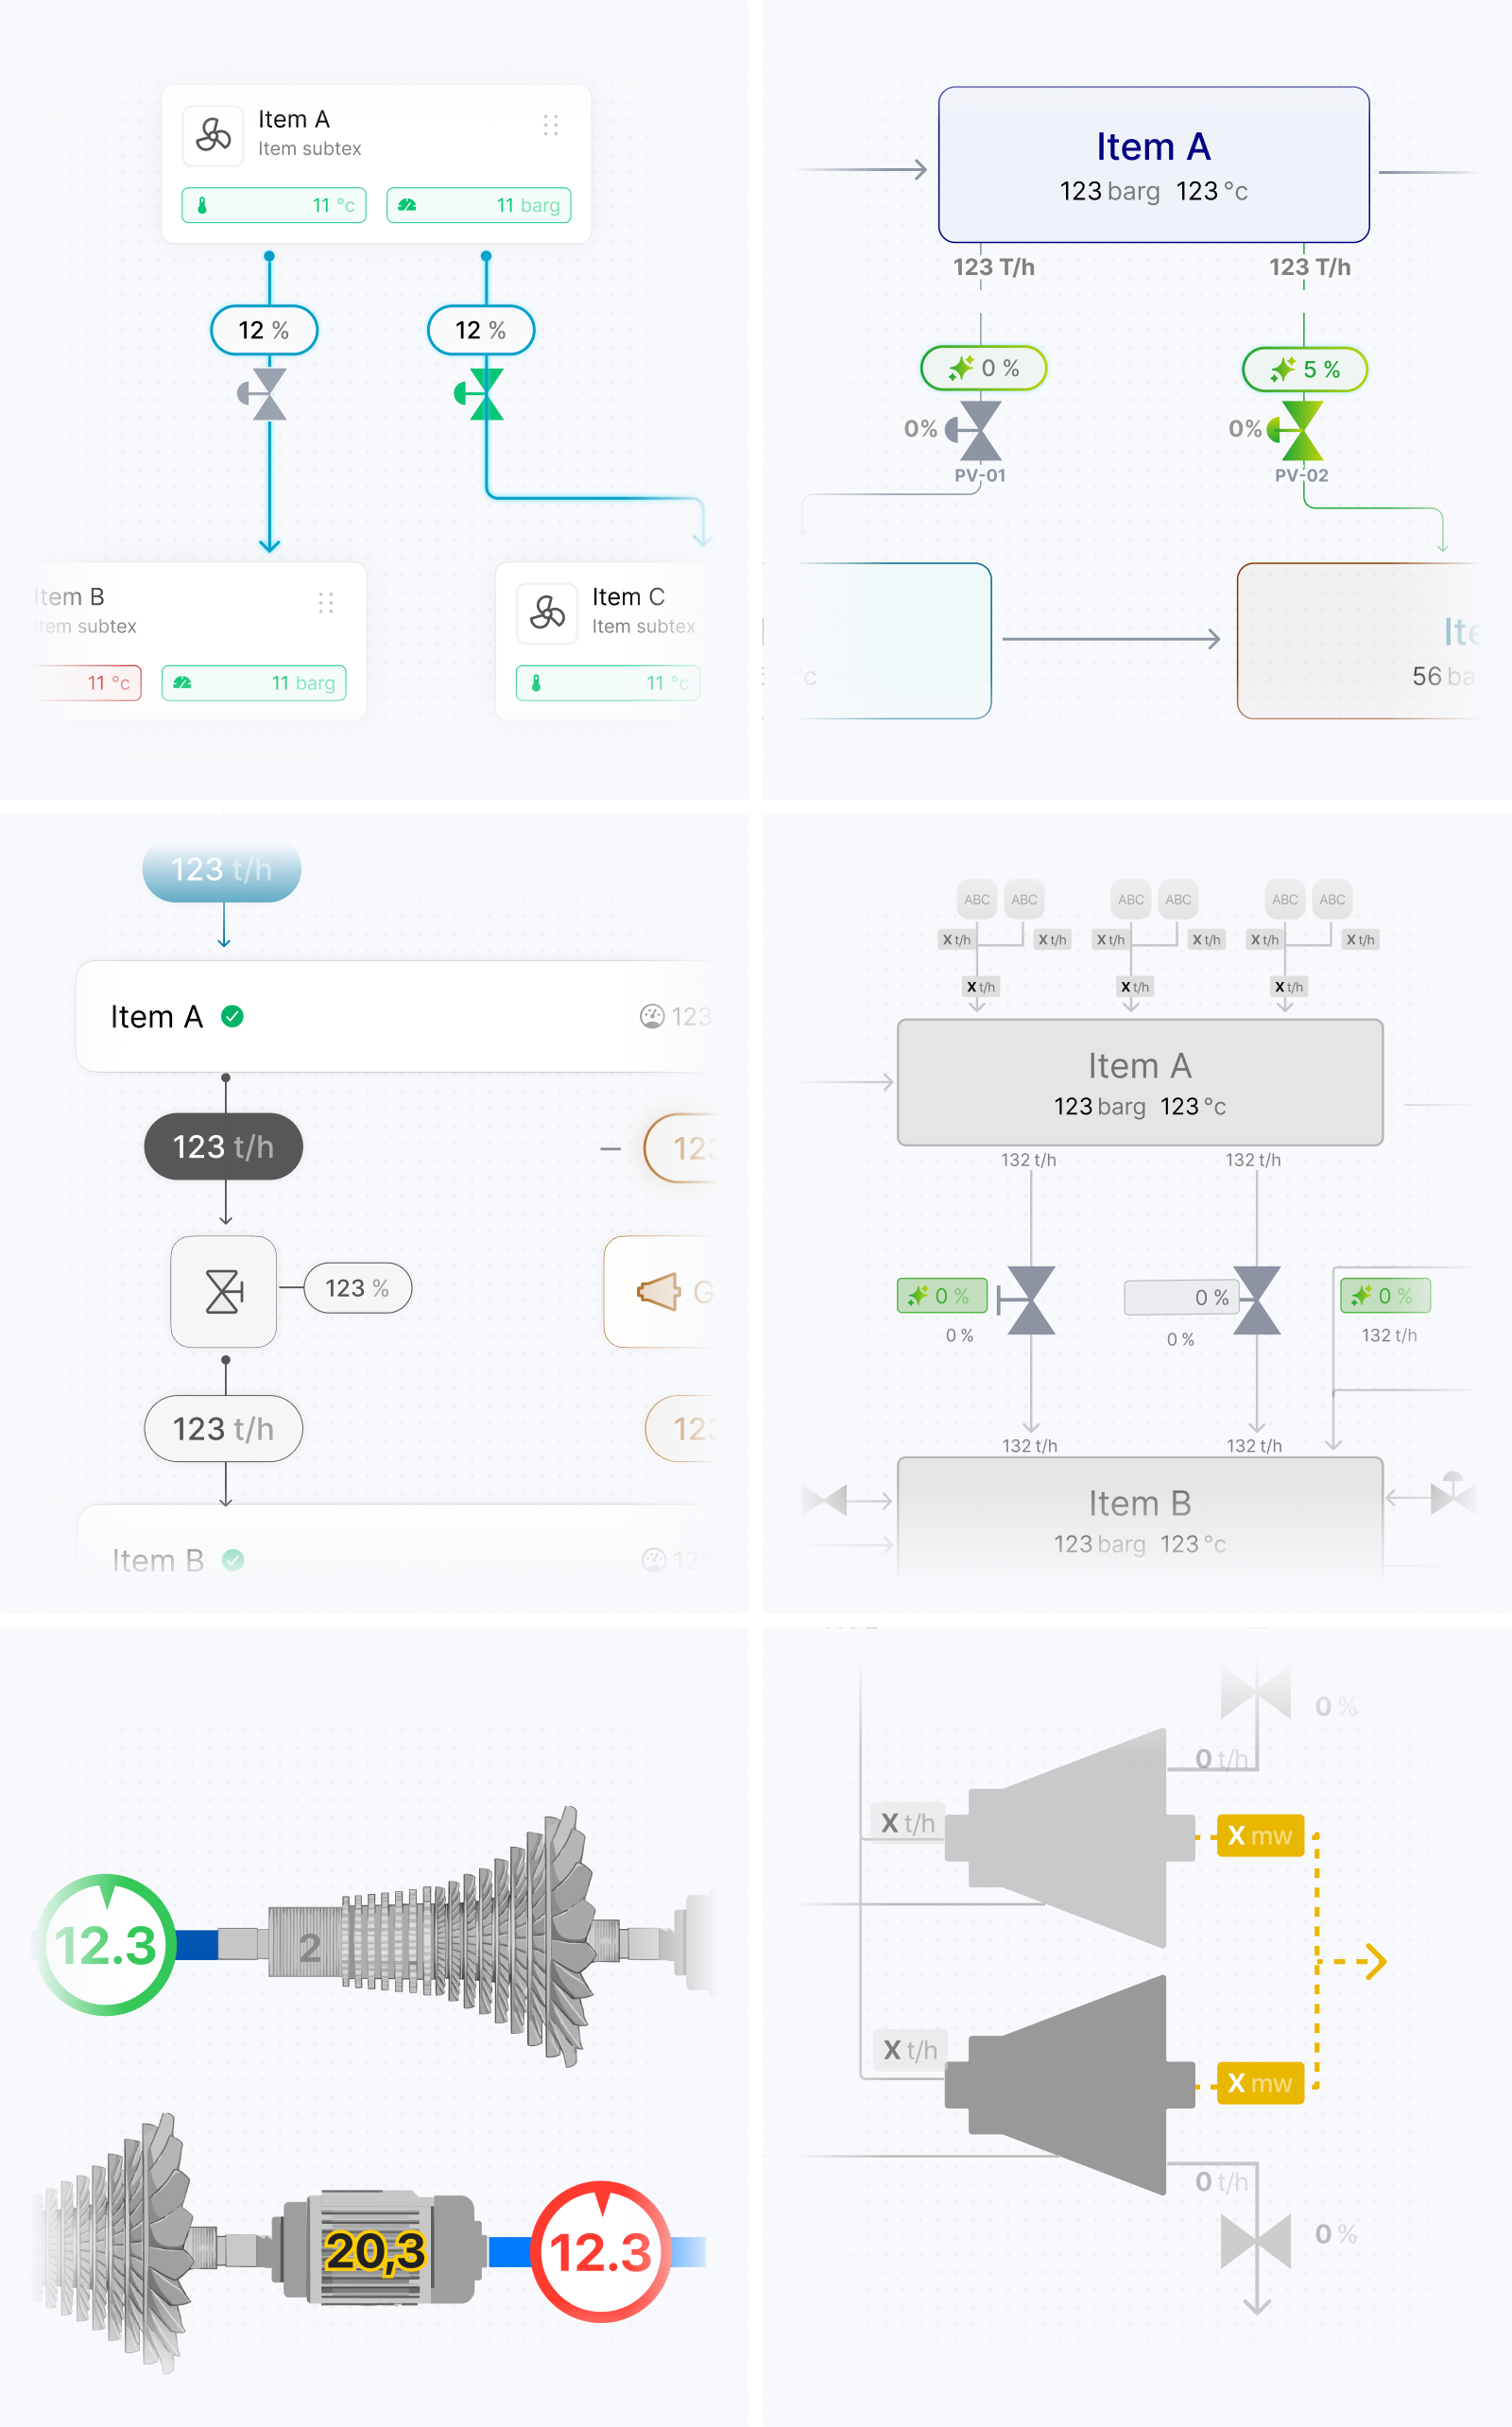
Once the overall representation direction became clearer, the next challenge was deciding how much of the operational network to show at each level. The platform needed to provide an overview of the entire network across multiple sites while still supporting the operational differences and detailed decisions within each individual site. Displaying every producer, consumer, collector, turbine, valve, and transfer in a single diagram would have recreated much of the complexity we were trying to reduce. I structured the visualization around two levels of detail. The network-wide view aggregated each site into its main operational blocks and surfaced the totals and exchanges needed to understand the overall energy balance. Users could then move into a dedicated site view where the same model expanded to reveal its specific production and consumption sources, collectors, turbines, valves, and connections. This progressive disclosure preserved a recognizable relationship between the two levels while preventing the overview from becoming overloaded.
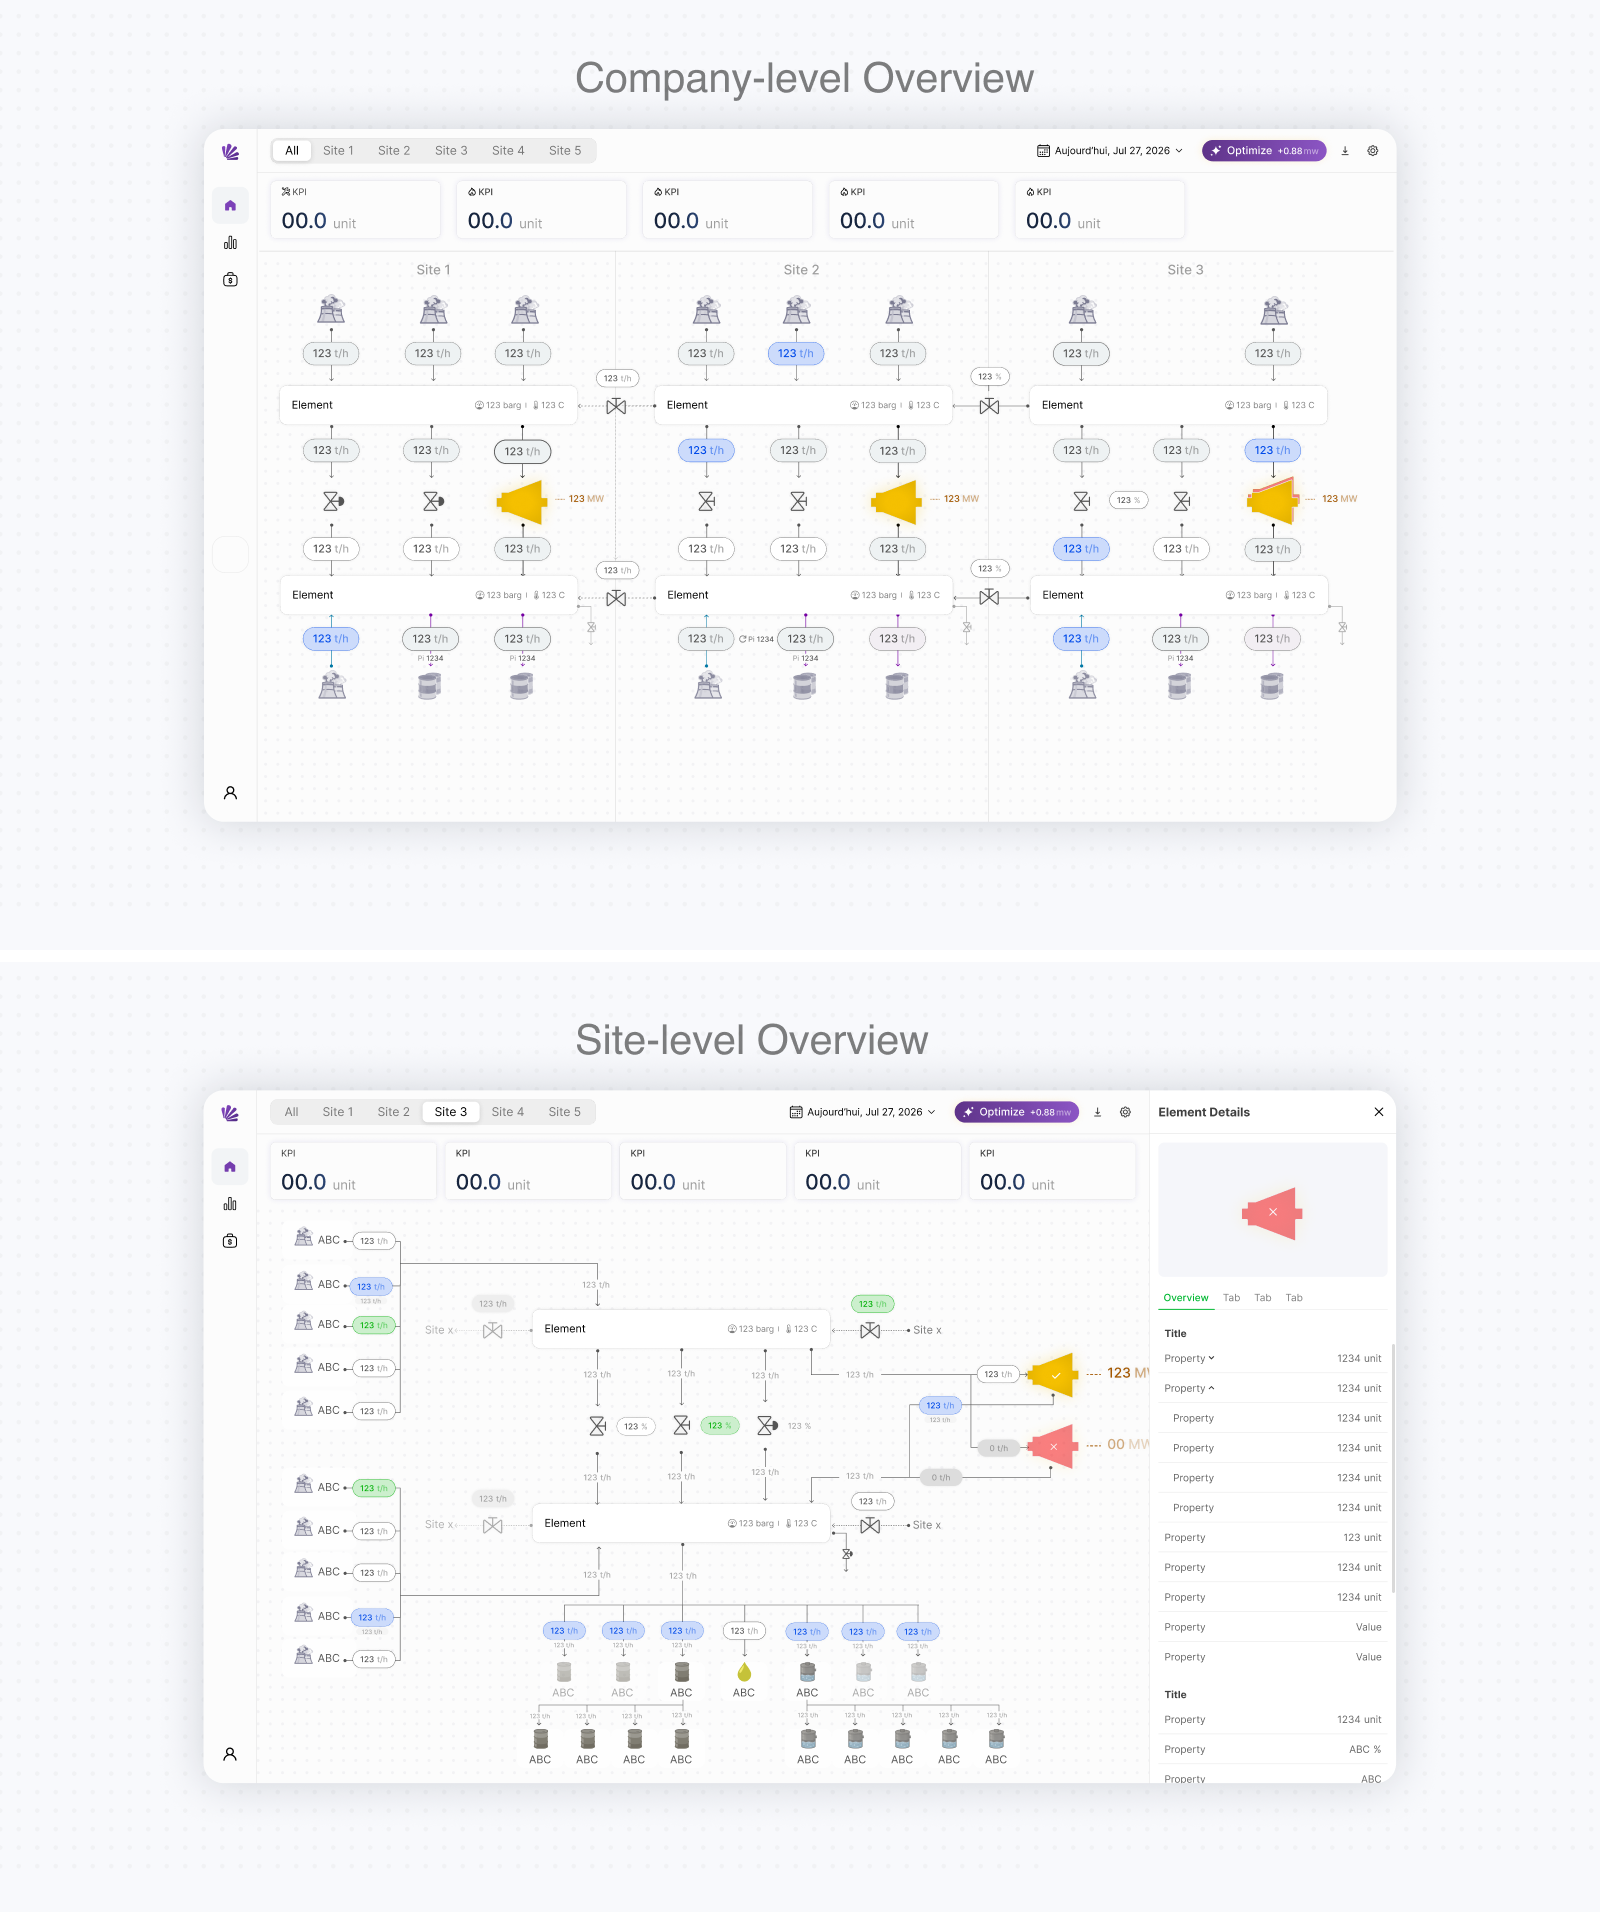
Deciding what to aggregate was not purely a layout problem. Some production and consumption values needed to be combined into totals to make the overall balance understandable, while others had to remain separate because their source, destination, or operational role affected the decisions users could make. Equipment also required different levels of information depending on context. At the overview level, users primarily needed to recognize significant exchanges and overall system conditions. Within a site, they needed more detailed information about turbine output, valve state, equipment availability, and whether an element was active, inactive, or experiencing a problem. The layouts continued to evolve as additional blocks, constraints, and operational relationships became clearer through reviews. New production and consumption details sometimes appeared after screens had already been refined, requiring parts of the flow to be reorganized. Rather than treating each diagram as a fixed composition, I progressively developed a modular visual system that could accommodate site-specific differences while maintaining consistent components, spacing, directional logic, and status patterns.
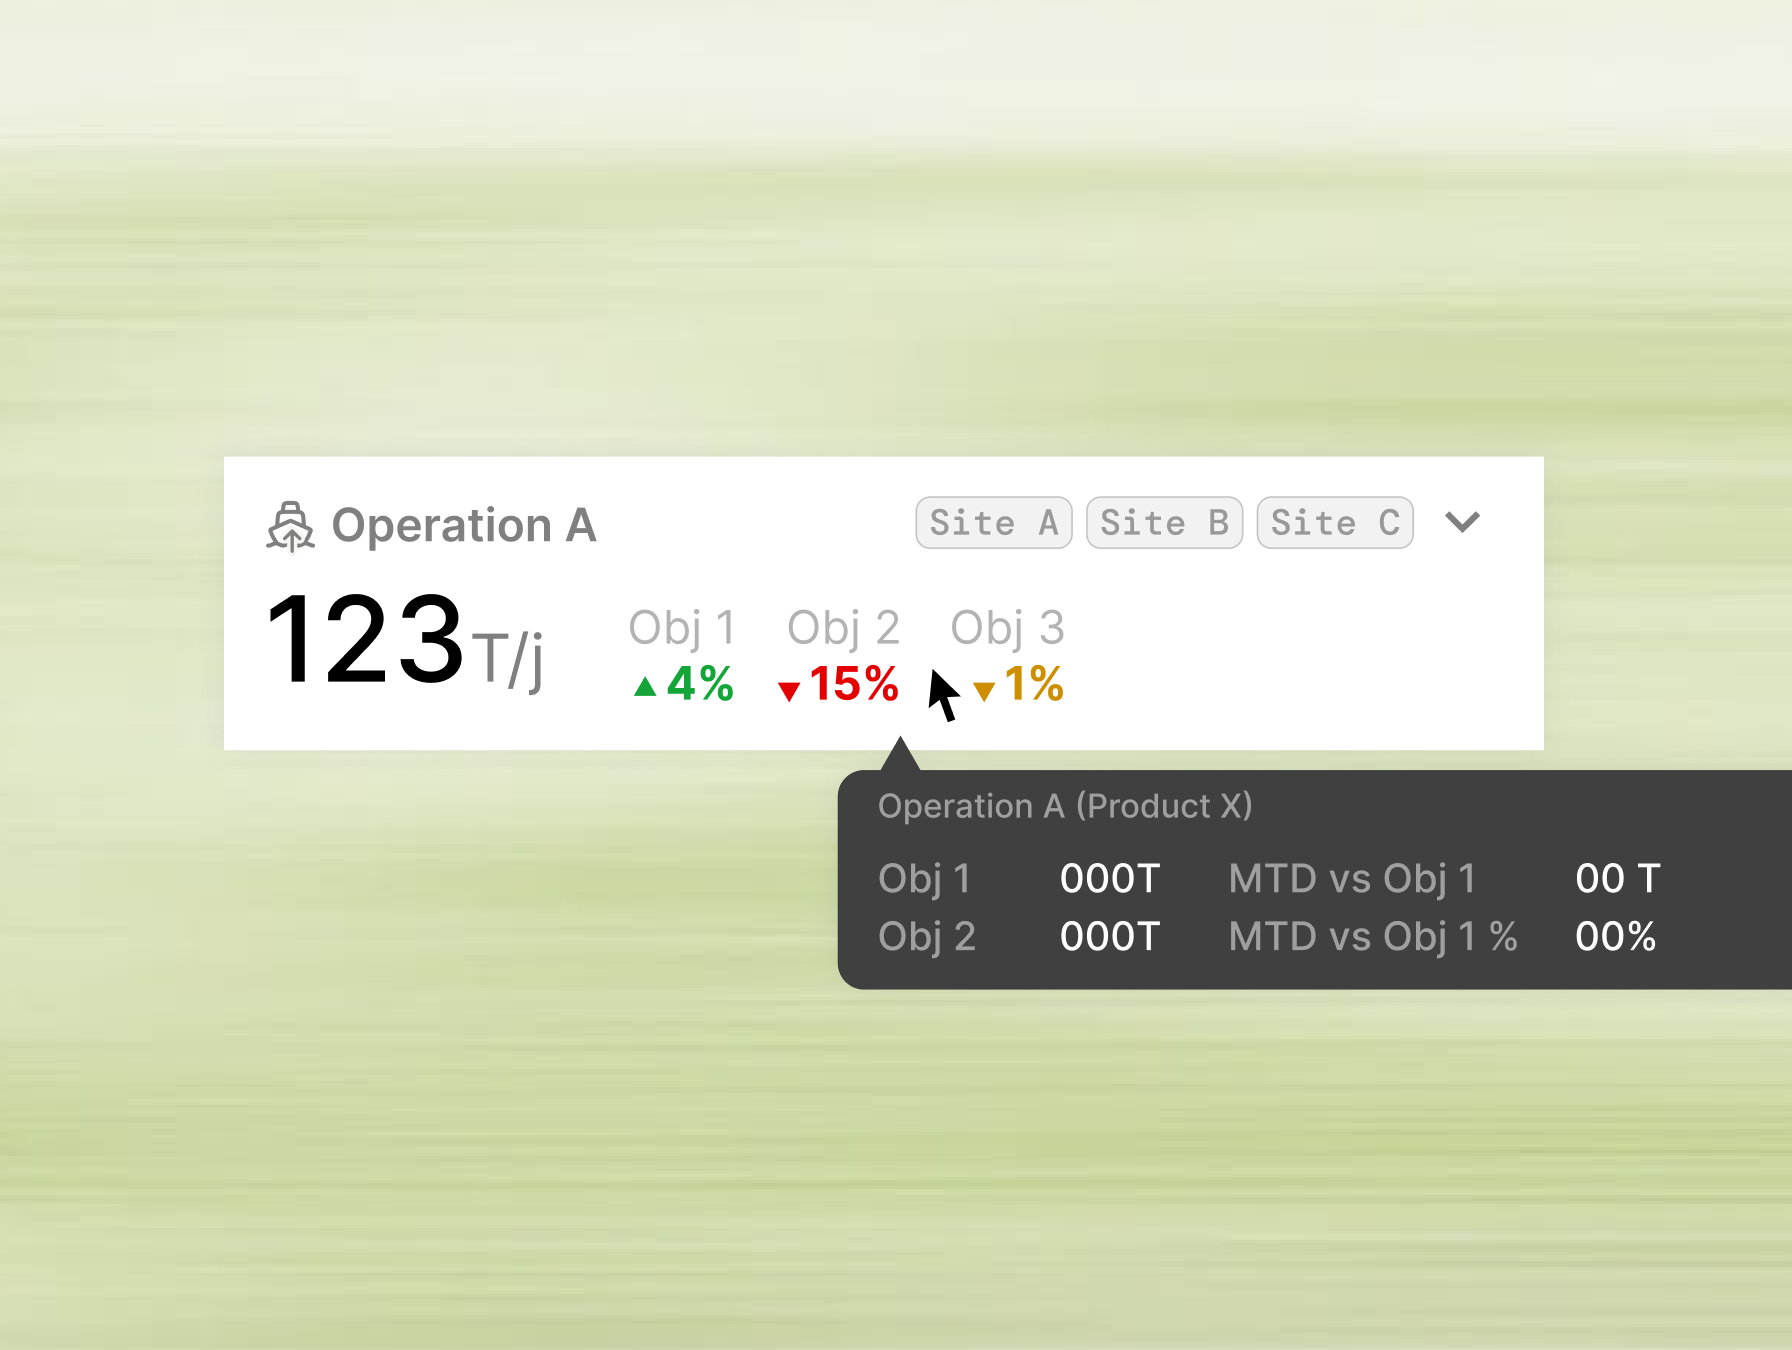
The diagram also needed to function as part of the product rather than as a static technical illustration. Summary indicators surfaced the main production, consumption, exchange, and electricity-generation values, while navigation and contextual controls allowed users to move between the network overview and individual sites without losing their operational context.
Designing inputs for operational constraints and scenarios
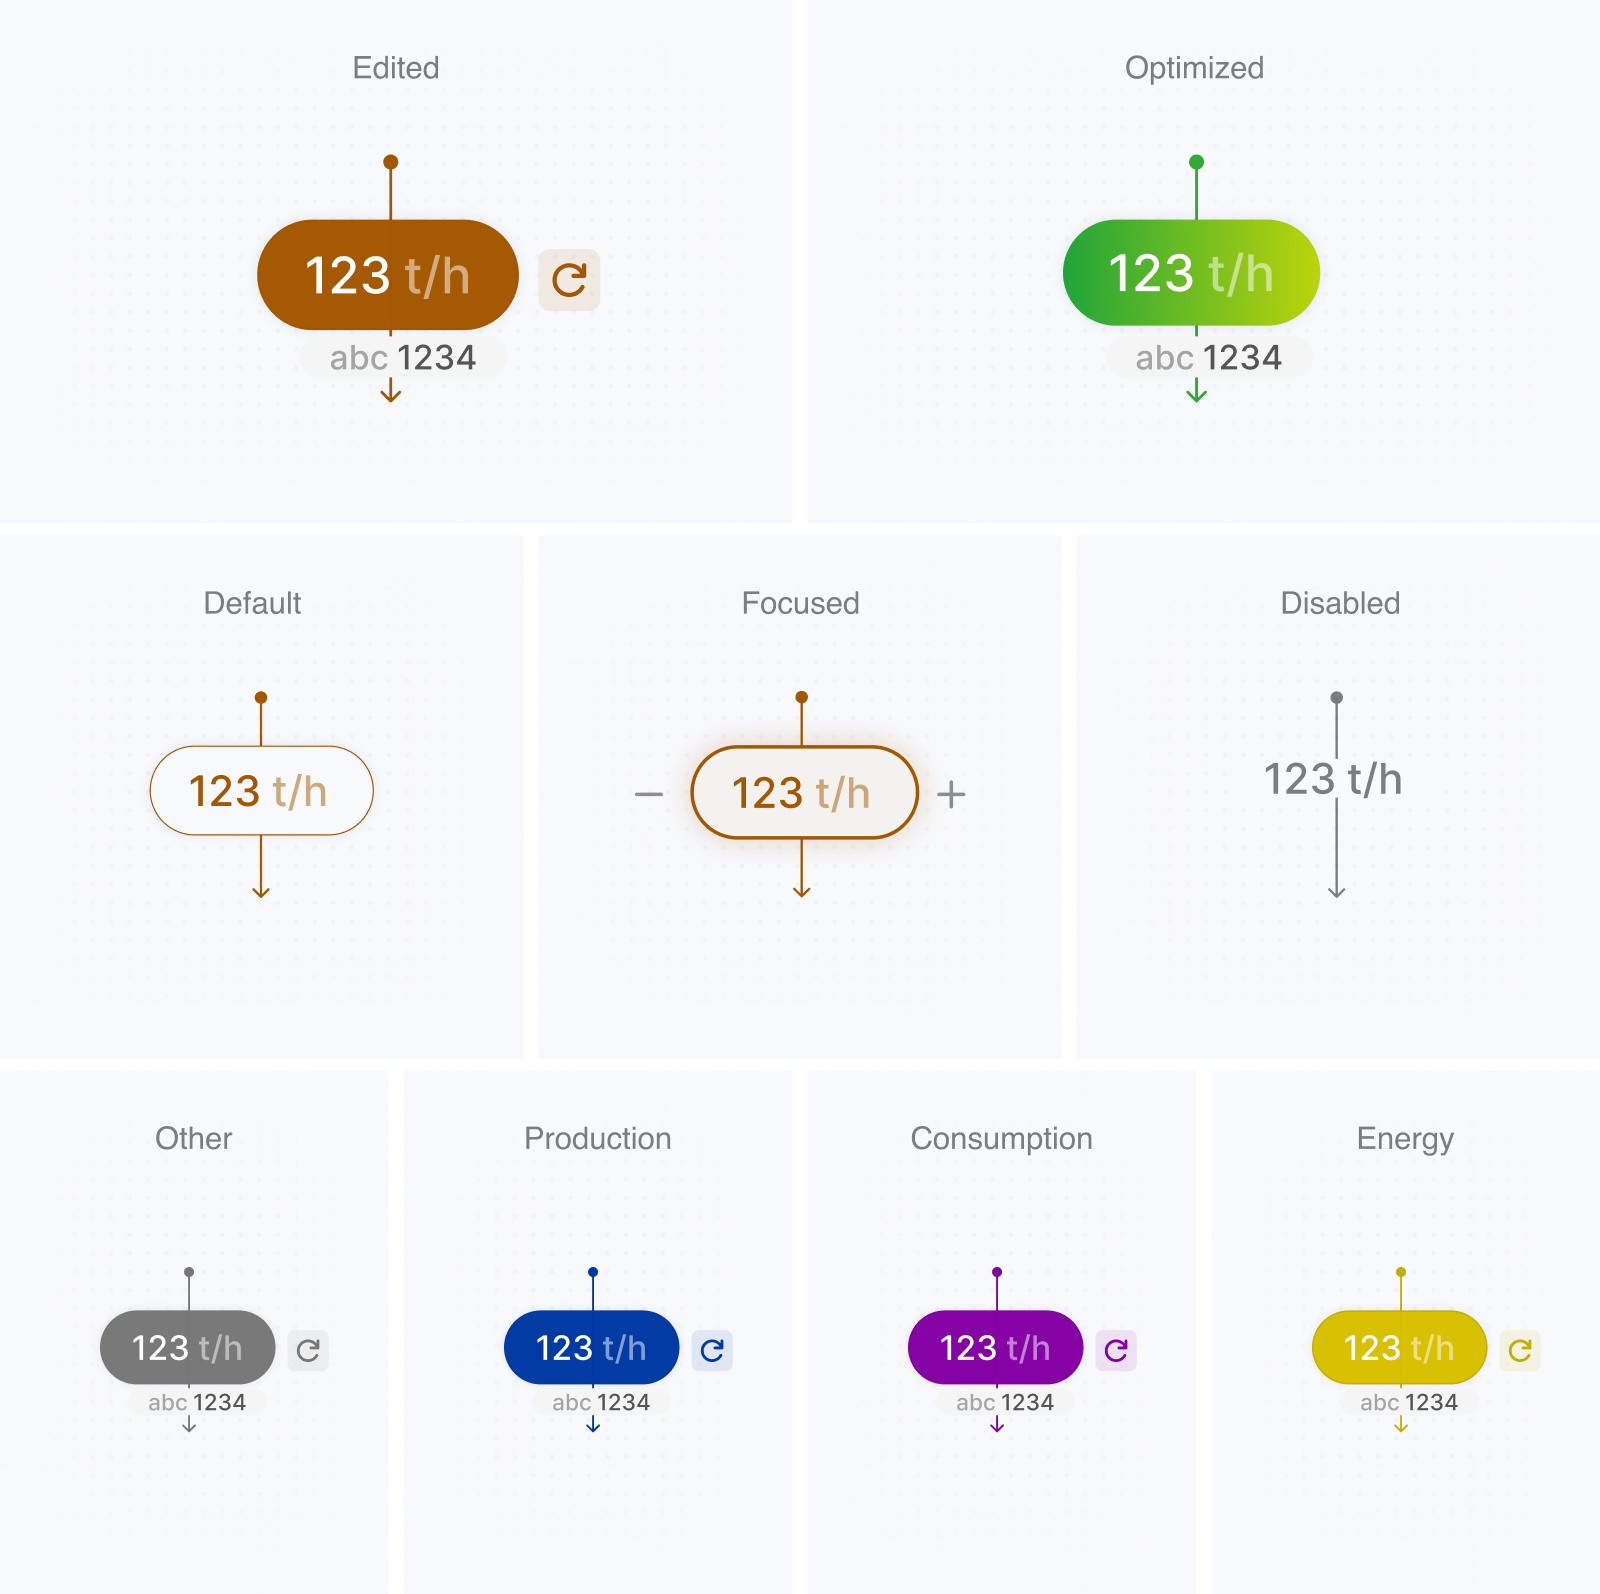
Once the representation and hierarchy became clearer, the challenge shifted toward interaction design and operational inputs. What initially seemed like a simple distinction between editable and fixed values became increasingly complex as we better understood the workflow. Operators needed to immediately understand which values they could modify and which were generated, calculated, or constrained by the system. Some inputs needed to display the current operational value before allowing a change. Others existed primarily as parameters for the optimization model while still remaining editable when users created alternative scenarios. Certain values also behaved differently depending on the equipment state or operational context. The interaction system therefore had to communicate more than whether a field was editable; it also needed to clarify the role of each value within the process.
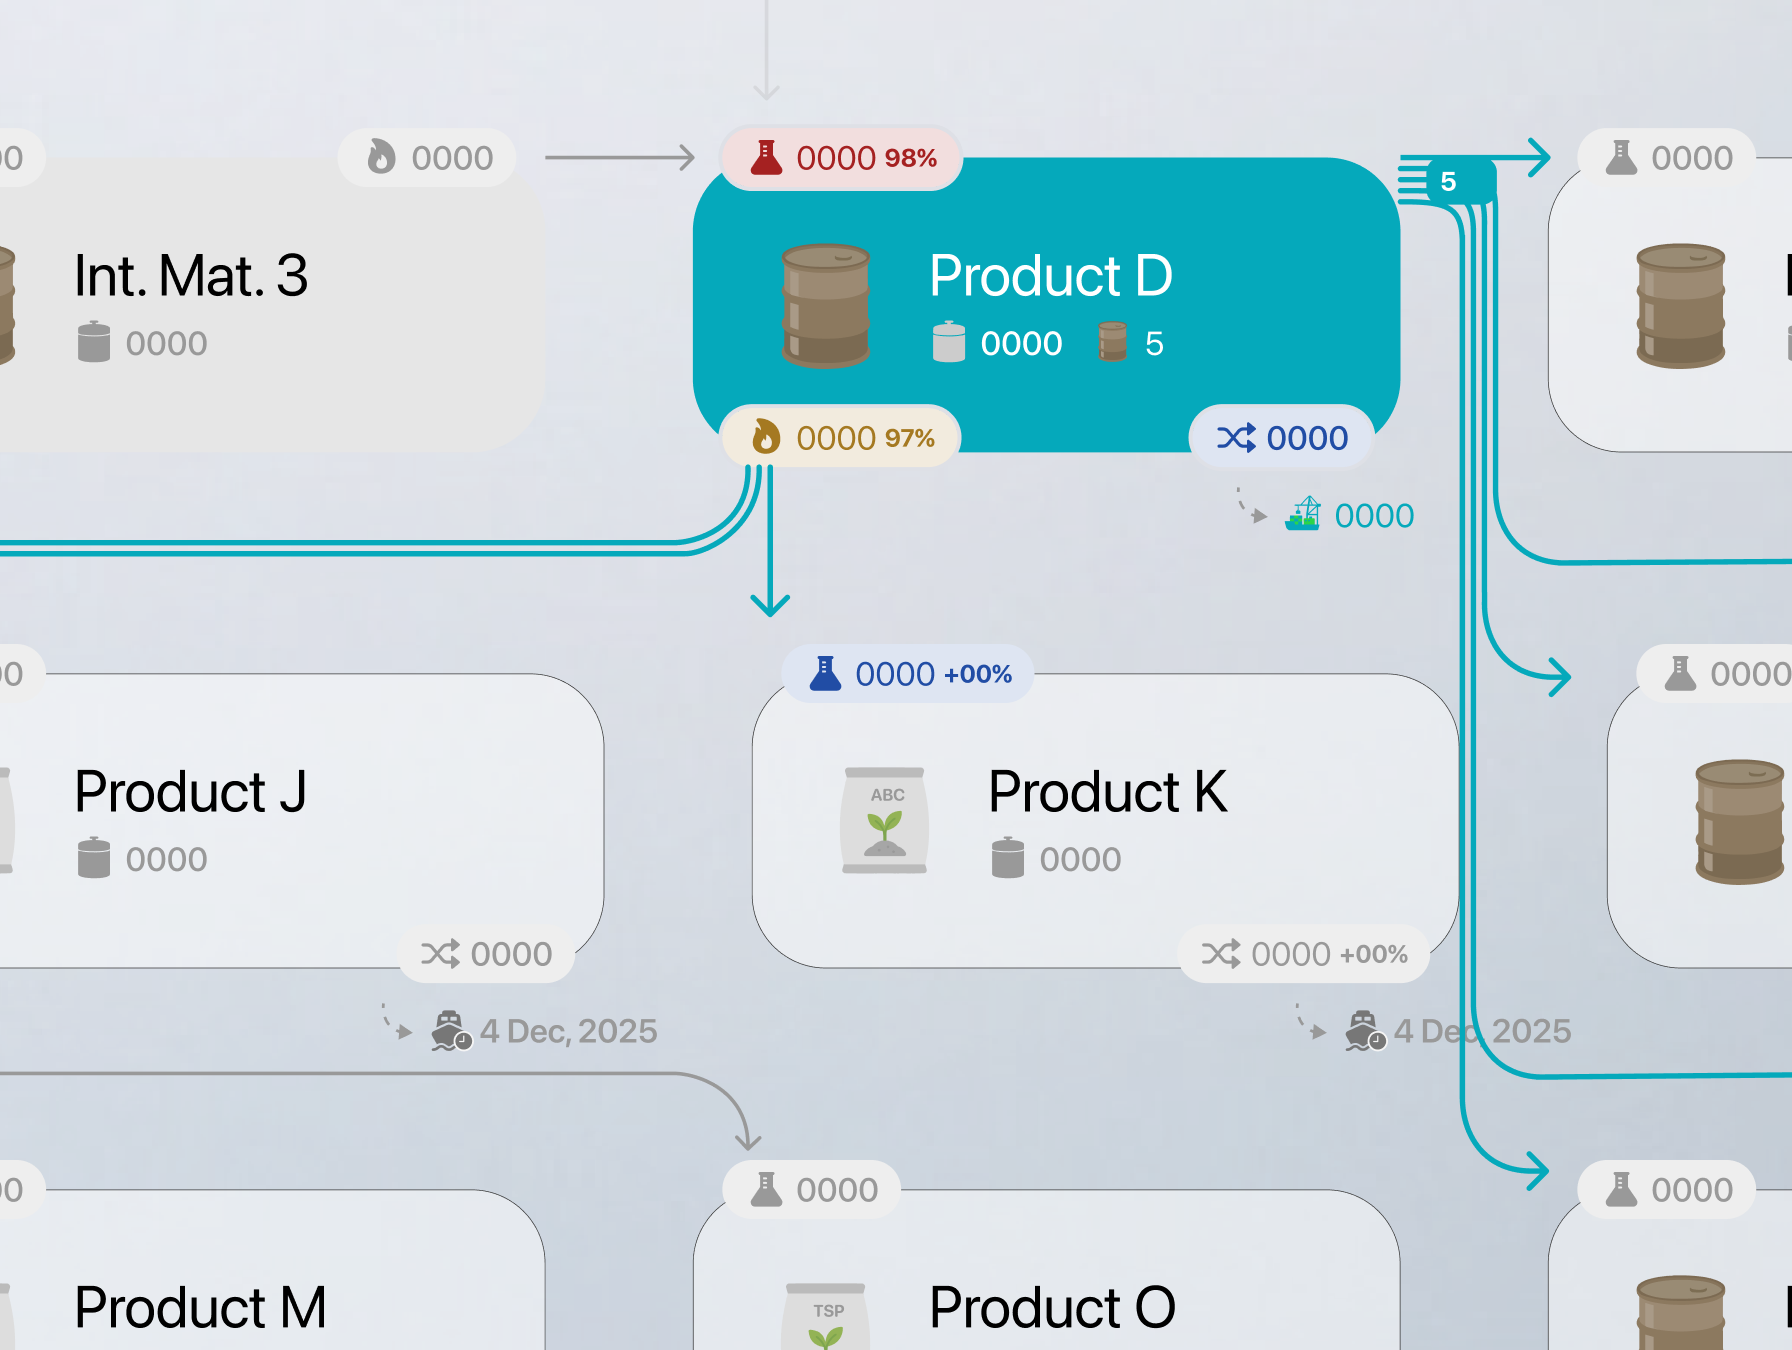
I began structuring values according to their function in the workflow: current operational values, editable parameters, system constraints, calculated outputs, and optimized recommendations. Current values provided the reference point, while proposed changes needed to remain visually distinguishable without disconnecting them from the part of the diagram they affected. Recommended values also needed to be recognizable as model outputs rather than direct system measurements. To avoid turning the monitoring interface into a large form, frequently adjusted values remained connected to their operational context, while less frequent configuration choices could be handled through dedicated settings or scenario controls. The interaction model continued to evolve alongside our understanding of how operators reasoned through constraints and scenarios. Establishing a consistent system for these value types became essential for supporting both optimization and simulation without requiring users to relearn the interface between modes.
Designing operational states across the diagram
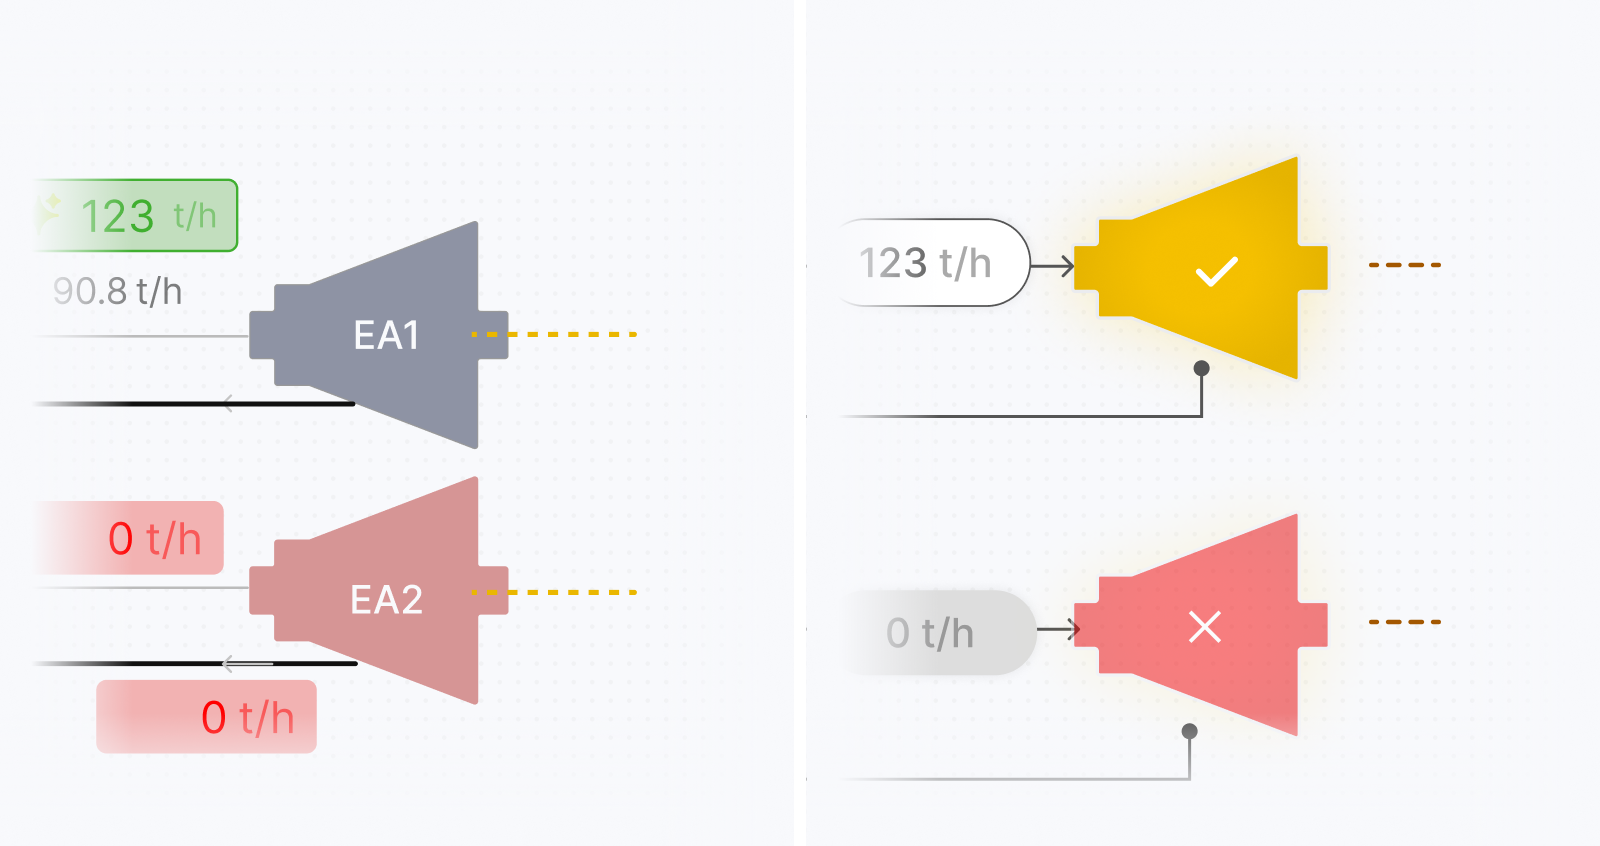
After the structural model became more stable, the visual direction needed to communicate a large number of values and equipment states without making the diagram visually noisy. The interface had to distinguish current conditions, editable parameters, recommended values, transfers, electricity generation, warnings, and inactive equipment while maintaining a coherent operational view.
Several visual approaches were explored before settling on a more restrained system. Neutral treatments were used for the underlying equipment and structure, allowing color to carry operational meaning rather than decorate the interface. Different treatments helped distinguish current values from optimized recommendations, while turbines, valves, and other equipment needed recognizable states for active, inactive, constrained, or problematic conditions. The iconography was also refined to represent the main types of production sources, consumers, collectors, turbines, valves, and transfers consistently across sites. Because each site had different equipment and operational relationships, the visual system needed enough flexibility to accommodate local differences without creating a different design language for every configuration. The goal was not to reproduce the appearance of traditional industrial control software. It was to preserve the logic and familiarity operators relied on while improving hierarchy, scanability, and state recognition. The resulting direction used consistent equipment components, value treatments, status patterns, and connections so users could interpret unfamiliar site configurations through the same visual language.
Expanding the platform into monitoring and reporting
Once the operational structure became more stable, the project expanded to include dashboards and reporting for monitoring performance over time. Compared with the process-visualization phase, this work progressed more quickly because the underlying data model, operational terminology, and priorities were clearer by then. The reporting experience needed to go beyond showing historical production and consumption. It also needed to help teams understand how the network had performed, how much electricity had been generated, and whether operational decisions had moved the system closer to or further from the optimized scenario.
Designing for different industrial configurations
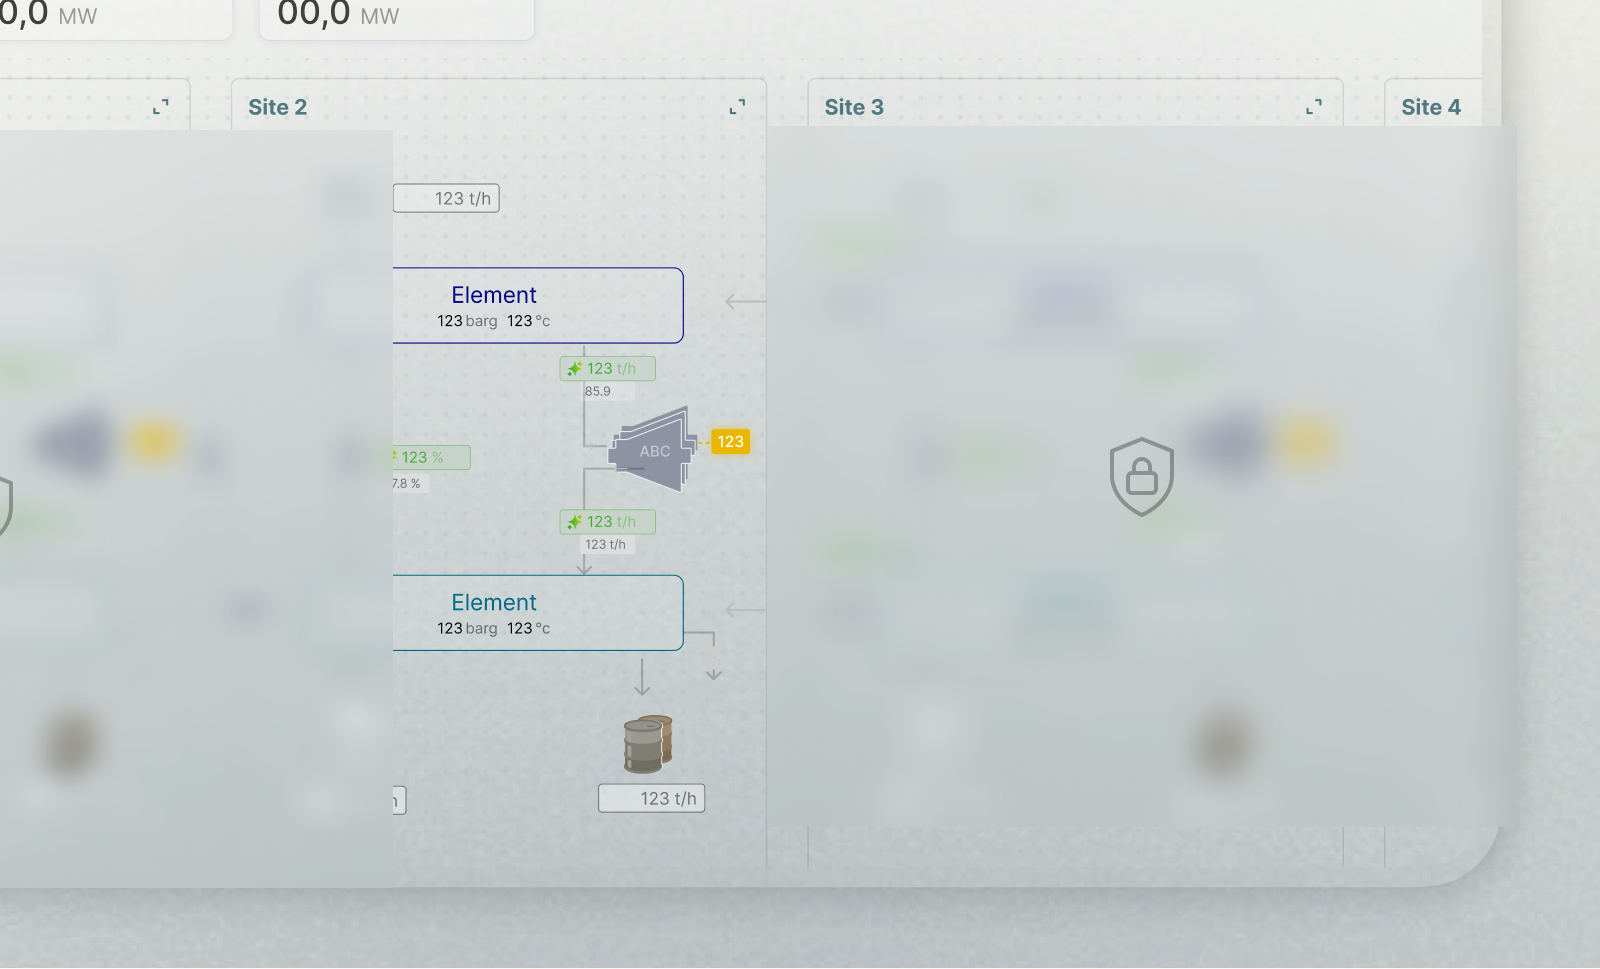
Industrial sites can share equipment types and operational concepts while differing in their connections and constraints. I designed reusable components and layouts that could accommodate these differences without forcing every site into the same diagram. The network and site-level structure provided a consistent foundation, while the details of each configuration remained visible where they mattered.
This influenced how I organized equipment components, value treatments, states, and layouts. Shared patterns stayed consistent across views, while site-specific details could vary without requiring a separate visual language for each configuration.
