
Redesigning a Water Pumping & Distribution Management System
A redesign of a large industrial client’s water-management interface, connecting pumping, storage, and distribution in one operational view. The work focused on understanding the network, inspecting individual assets, and modernizing shift reports while preserving the reporting practices used by each entity.
Context & Goal
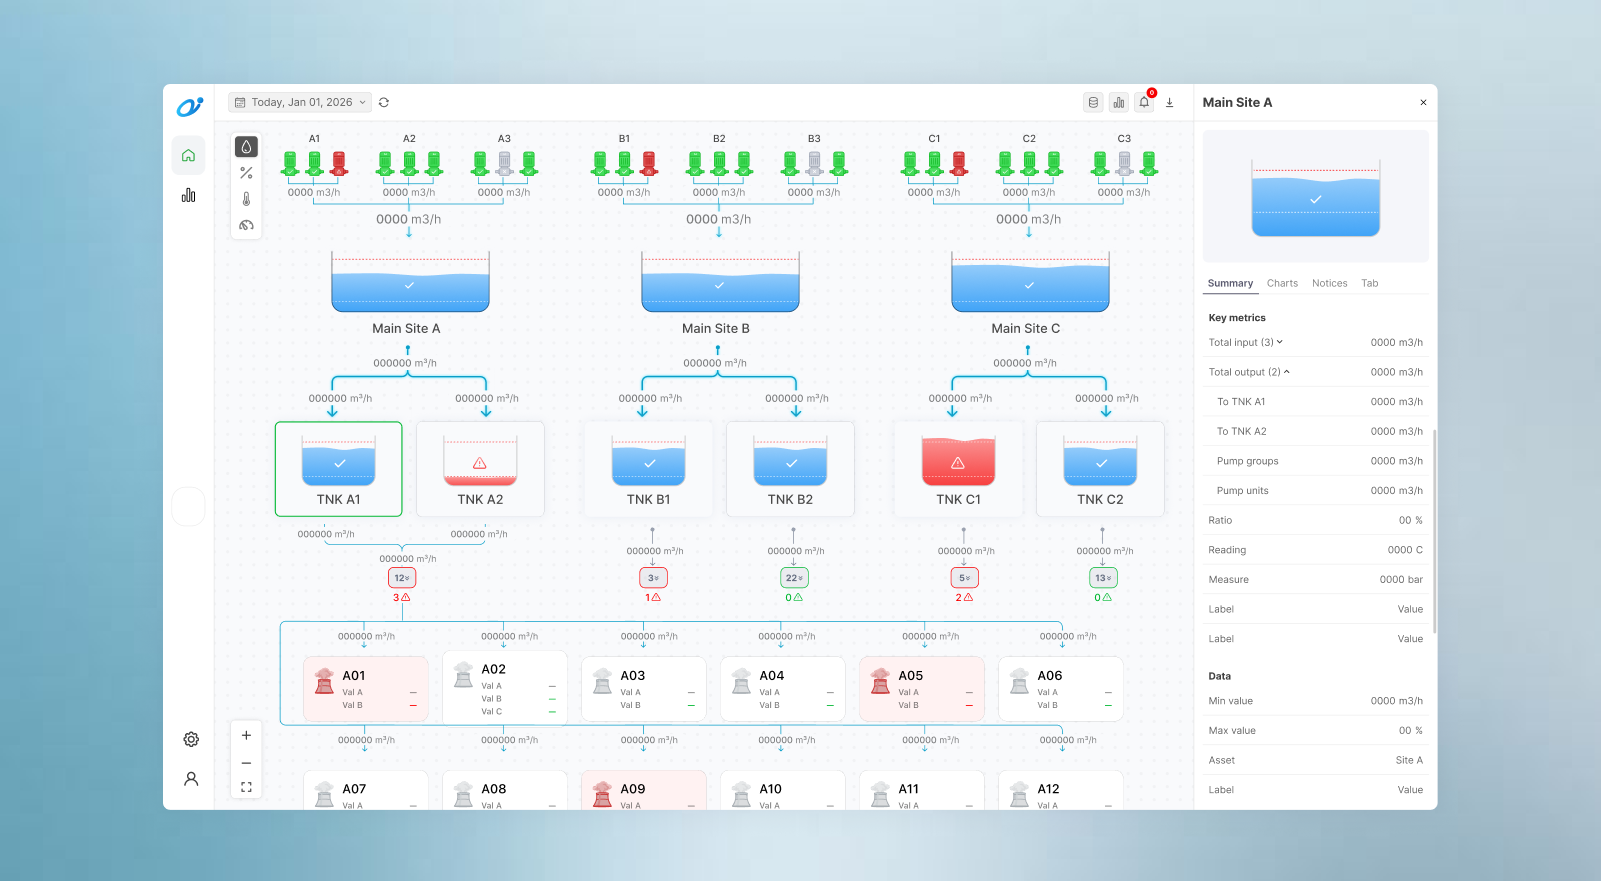
The client’s water distribution network connected pumping stations, reservoirs, tanks, and industrial clients whose operating conditions had to be monitored throughout each shift. The existing interface exposed so much asset information that operators had to scroll, zoom, and inspect different parts of the diagram before they could establish an overview. The goal was to make the network easier to understand and problems easier to locate, with detailed readings available when needed. The redesign also had to support the established shift-reporting practices used across sites within a tight development timeline and the limits of the available operational data.
Solution & Impact
The redesigned interface combines a compact network overview with contextual asset details and alerts, while four shift-report templates preserve the information required by different operational teams. Feedback from testing was strongly positive because operators could understand the distribution structure, distinguish pump states, and identify reservoir or client issues from the initial view before deciding what to inspect. The scope prioritized these immediate monitoring and reporting needs. Metric switching and hierarchical filters were left out of implementation, while the performance-report explorations remained a direction for future development.
Key Decisions & Tradeoffs
Everything in one snapshot
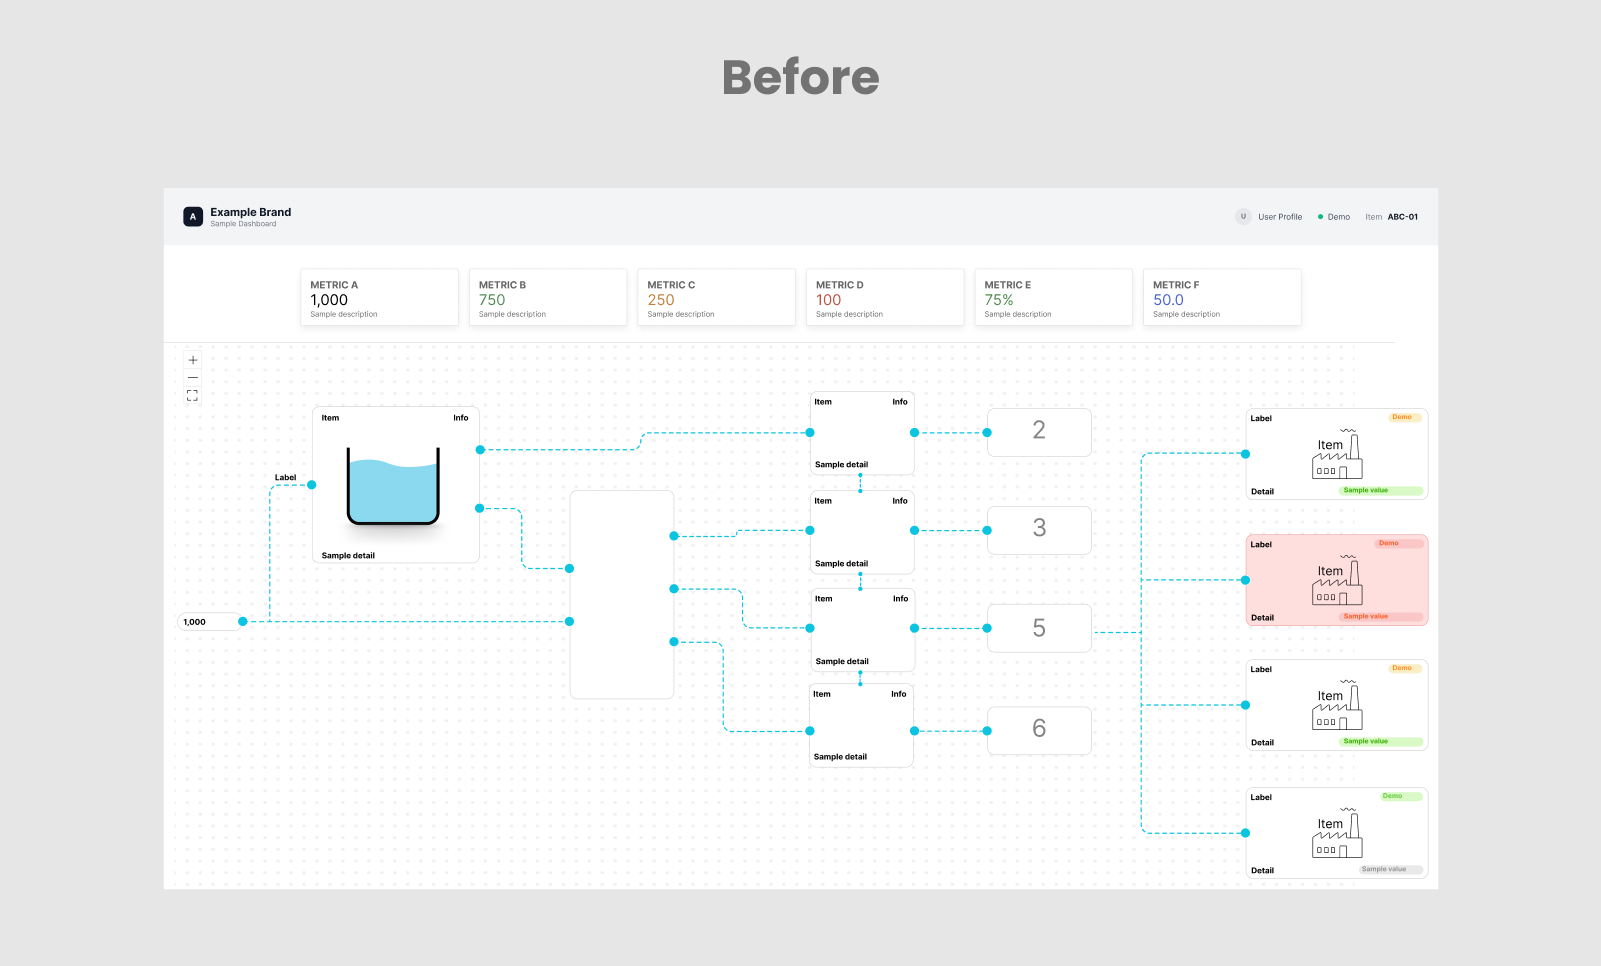
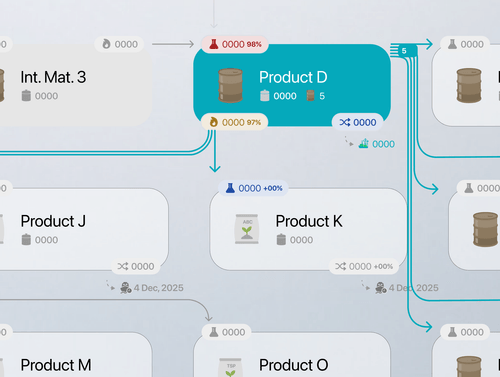
The water distribution network comprised pumps, large reservoirs, tanks, and numerous downstream clients, each with its own readings, states, and operational properties. The previous interface gave most assets similar visual weight and exposed too much information at once, so operators had to scroll, zoom, and move around the canvas to understand the network. Discussions with users clarified that their immediate priorities were to 1) see how the network connected and 2) quickly identify problems that required attention. The redesign therefore focused on fitting the core network into one view, with further details available when needed.
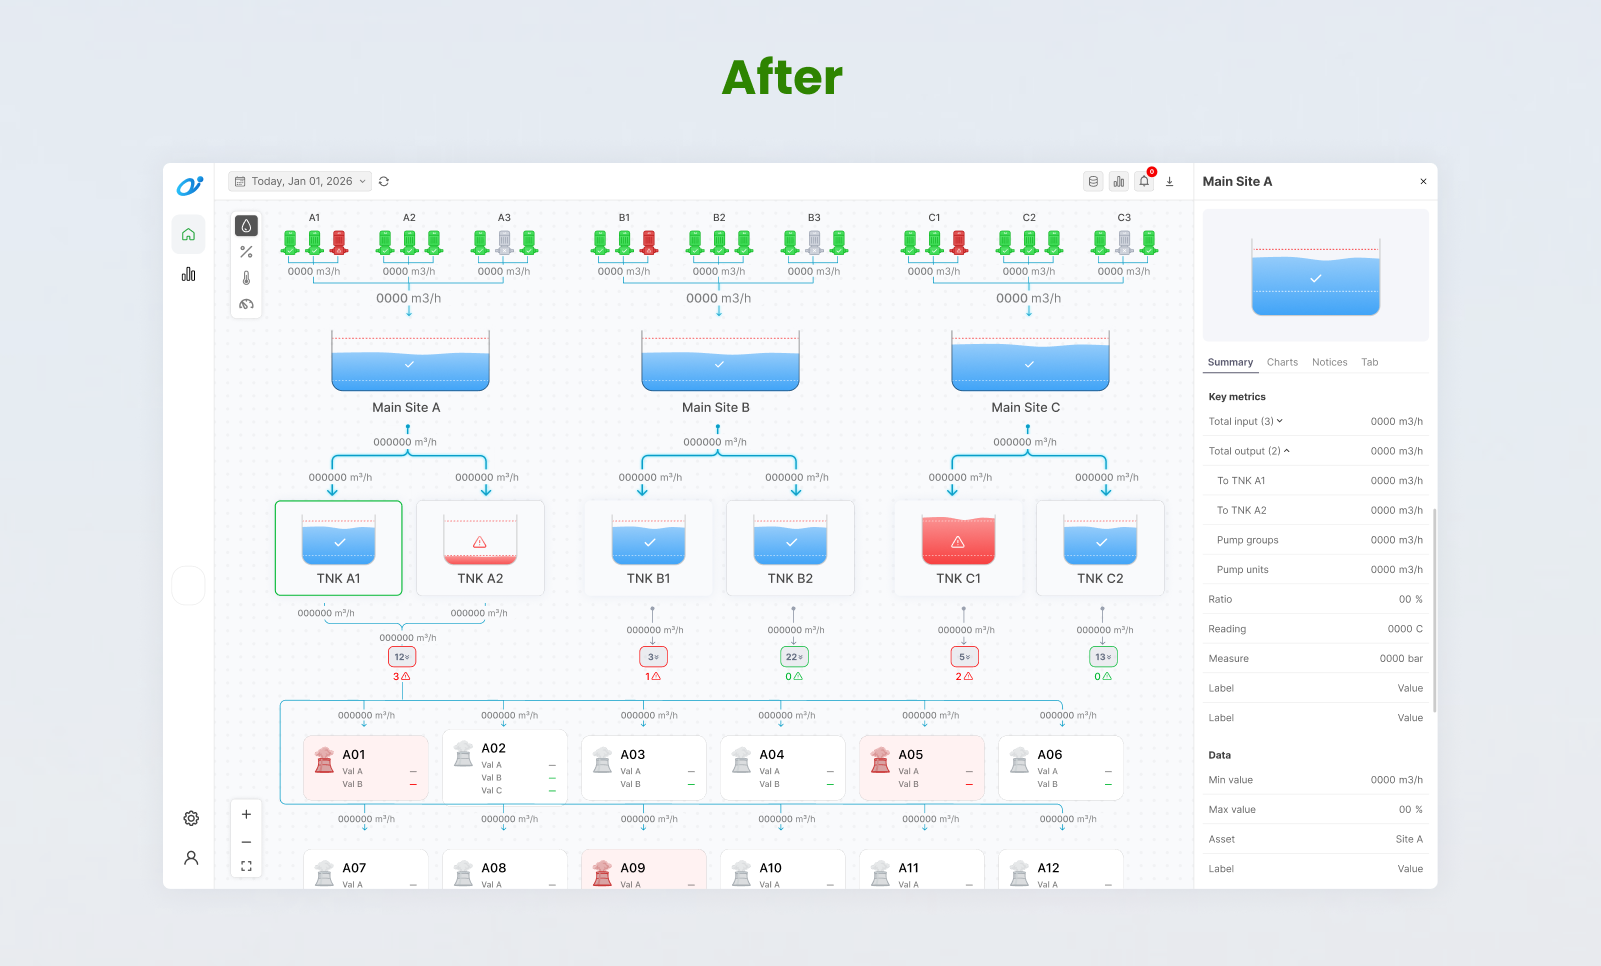
I reorganized the network from top to bottom, instead of left to right, according to the distribution sequence, with pumps above the main reservoirs, followed by downstream tanks and clients. Assets at equivalent stages shared the same horizontal level, while their visual weight reflected their importance to the overview. Pumps became compact status symbols with their operational grouping communicated through proximity, and the main reservoirs remained prominent.
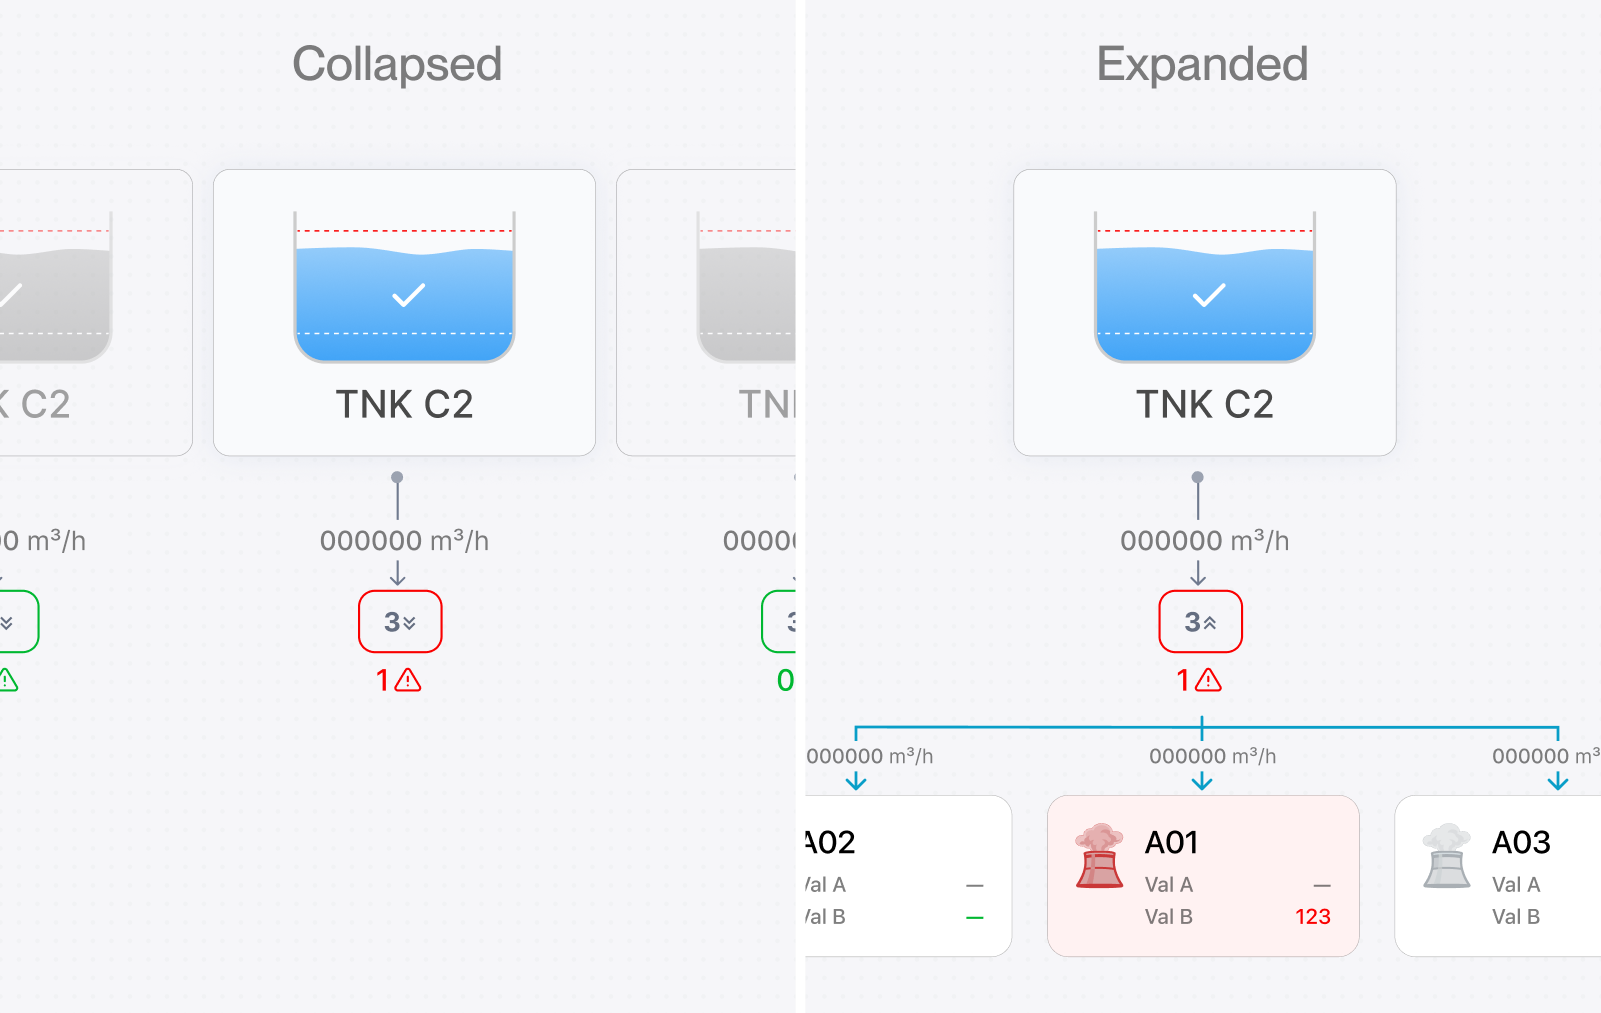
Clients accounted for a large proportion of the original cards, so their details were placed beneath expandable group controls. This reduced the initial density, but early testing showed that operators still had to open each group to discover whether a client had a problem. A visible issue count was therefore added to the collapsed state so that the overview could remain compact without concealing information that required action. Operators could then open the relevant group to identify the affected client rather than inspect every group in turn.
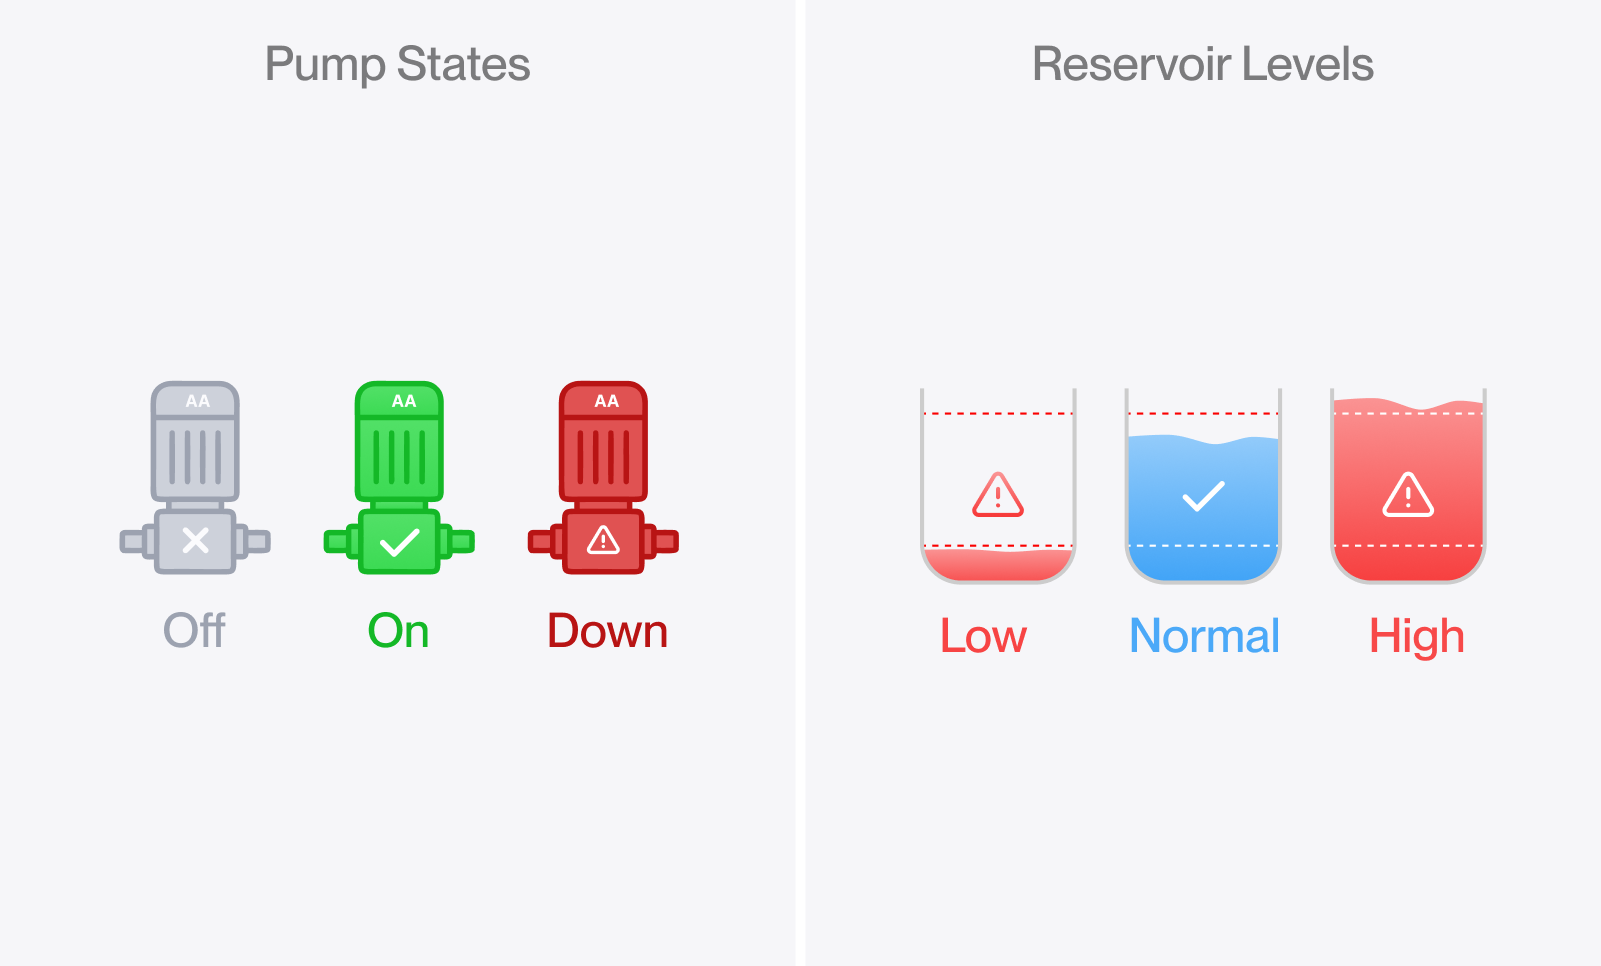
The asset graphics also carried more of the operational information directly. Pump states distinguished running, stopped and unavailable equipment, although maintenance and faults had to share the unavailable state within the available data model. Reservoir graphics reflected actual water levels against visible minimum and maximum thresholds. Normal water remained blue because it was a more intuitive representation of the content (instead of semantic green), while red and warning symbols drew attention to levels outside the operating range.
After these improvements, feedback from testing was strongly positive. Operators could see the overall distribution structure, distinguish pump states, and identify reservoir or client issues from the initial view. Detailed inspection remained available, but it was no longer a prerequisite for understanding whether the network needed their attention.
Switching metrics within the same network
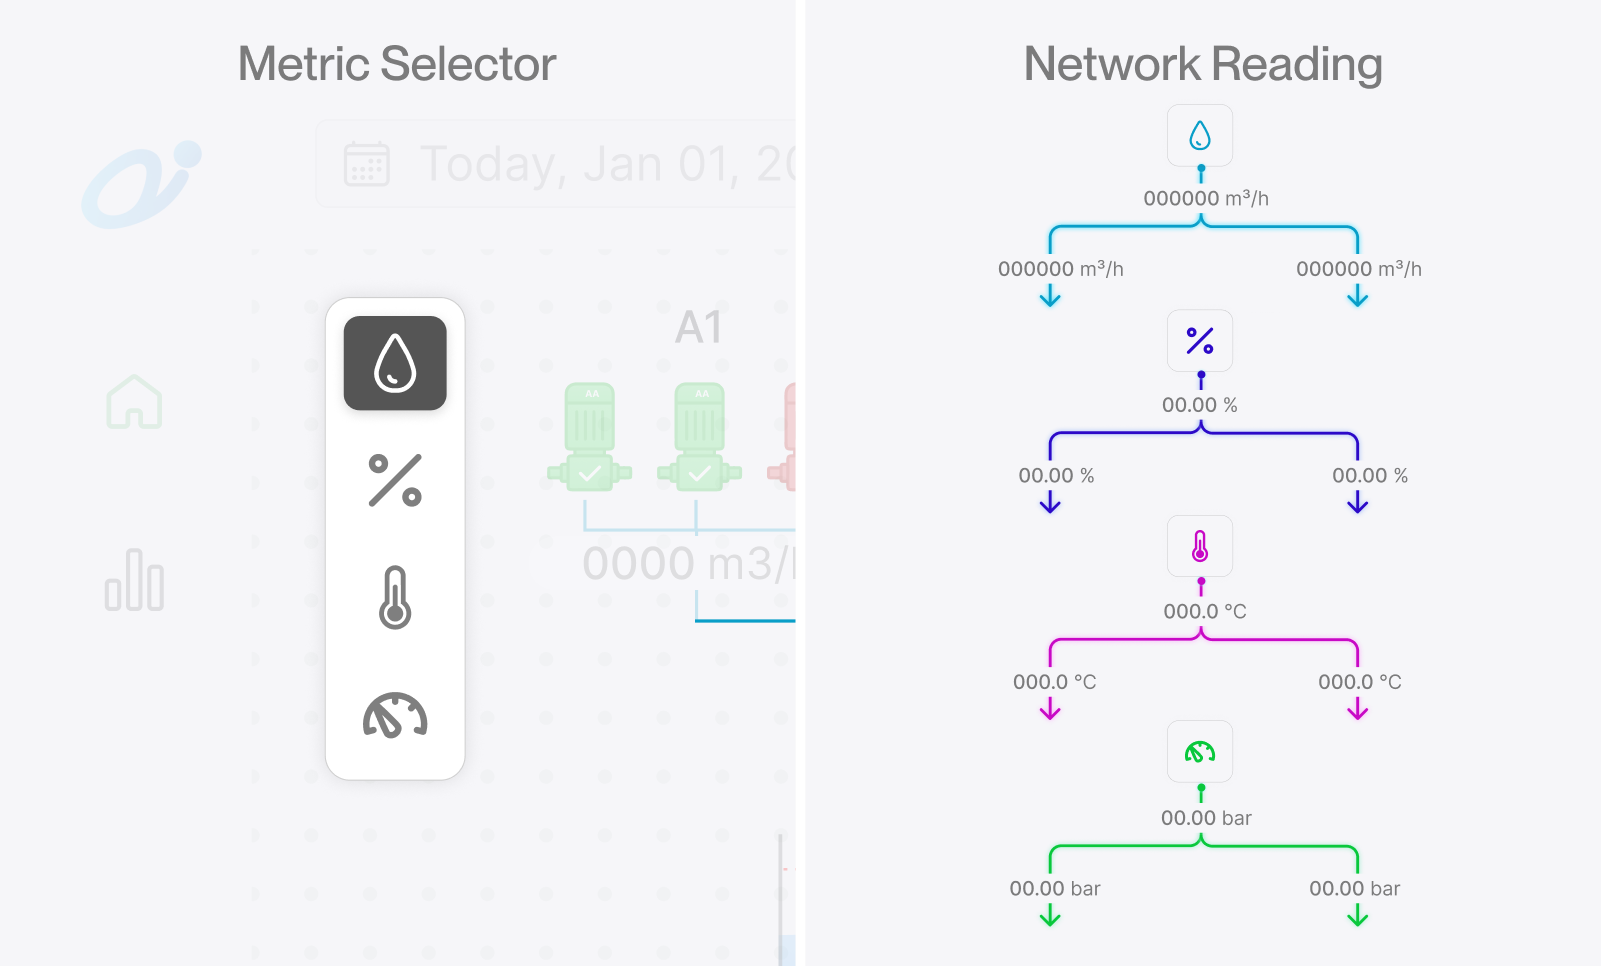
Once the network fit into one view, another challenge was how to show flow, percentage, temperature, and pressure for each relevant asset without overcrowding it again. A metric selector allowed operators to change the readings displayed across the diagram while its structure remained familiar. Although the concept was well received during design, early testing suggested that switching metrics would be less frequent than initially expected. Under a tight development deadline, it was left out of implementation because the additional readings were already accessible through each asset’s detail panel. The concept remained an exploration of a pattern that could be useful in other products.
Inspecting assets without leaving the network
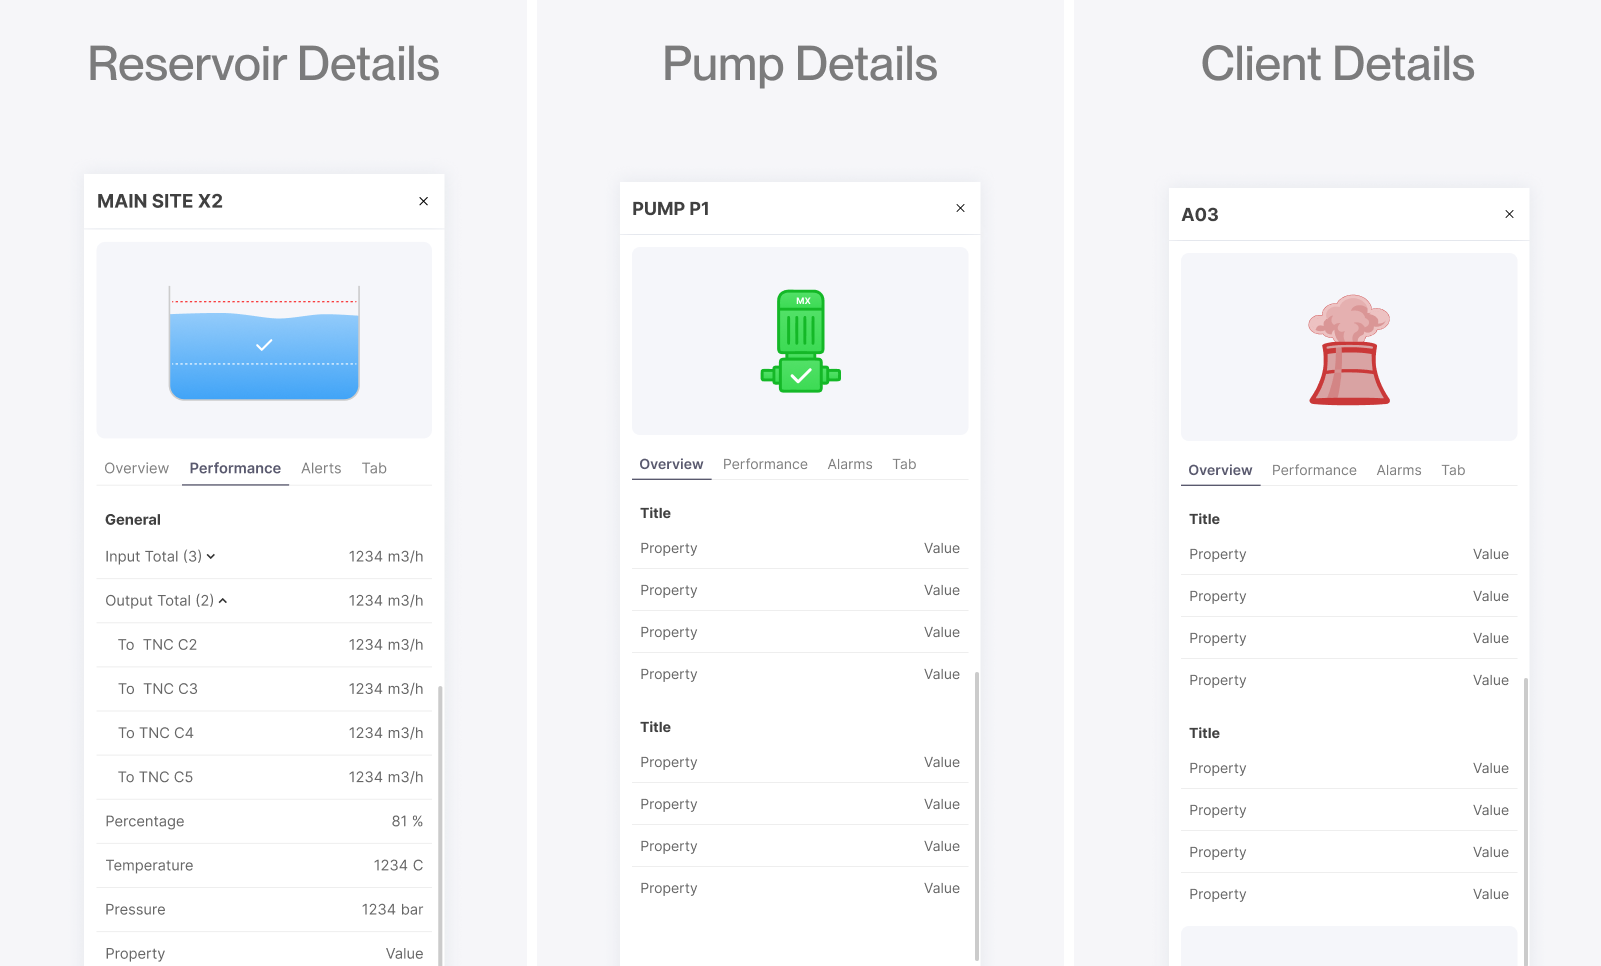
Although the overview exposed the information needed for initial monitoring, operators still needed access to the detailed readings and properties of each asset. Selecting a reservoir, pump, or client opened its information in a side panel whose structure adapted to the asset type. The network remained visible beside it so operators could inspect an item and move to another without losing their place or navigating between separate pages.
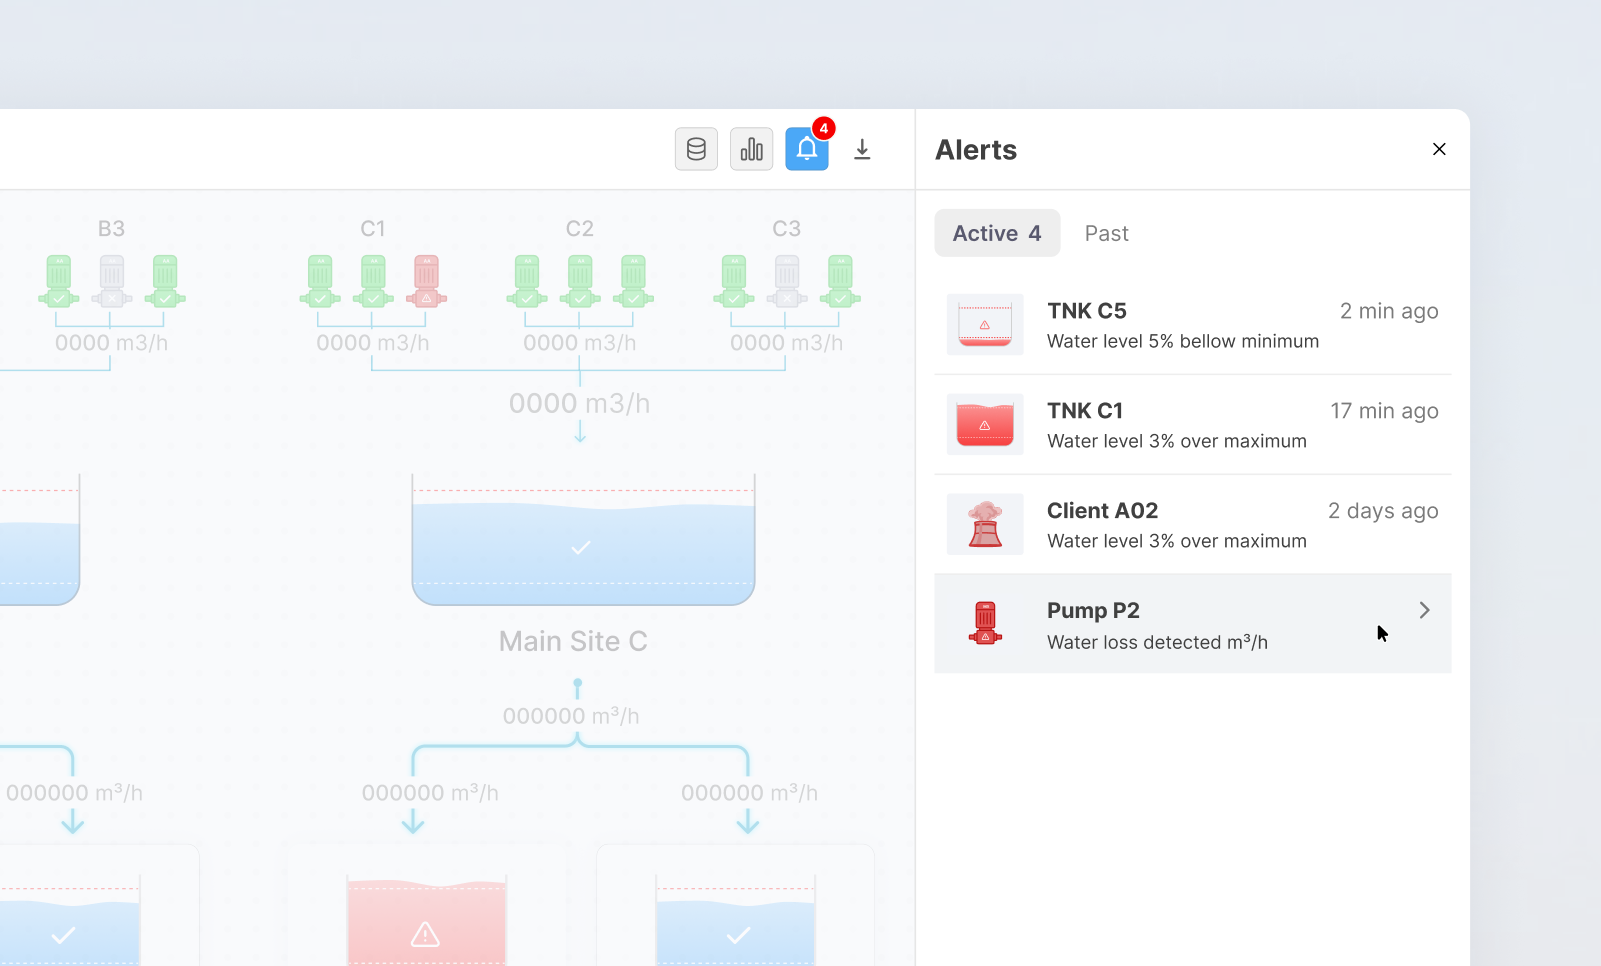
Once that panel became part of the workspace, the same area could support broader monitoring needs whenever no asset was selected. It displayed metrics for the overall network by default and could switch to alerts when operators needed to review issues across different assets. The panel therefore adapted to the current task while the diagram remained a consistent point of reference.
Structuring performance reports around the network
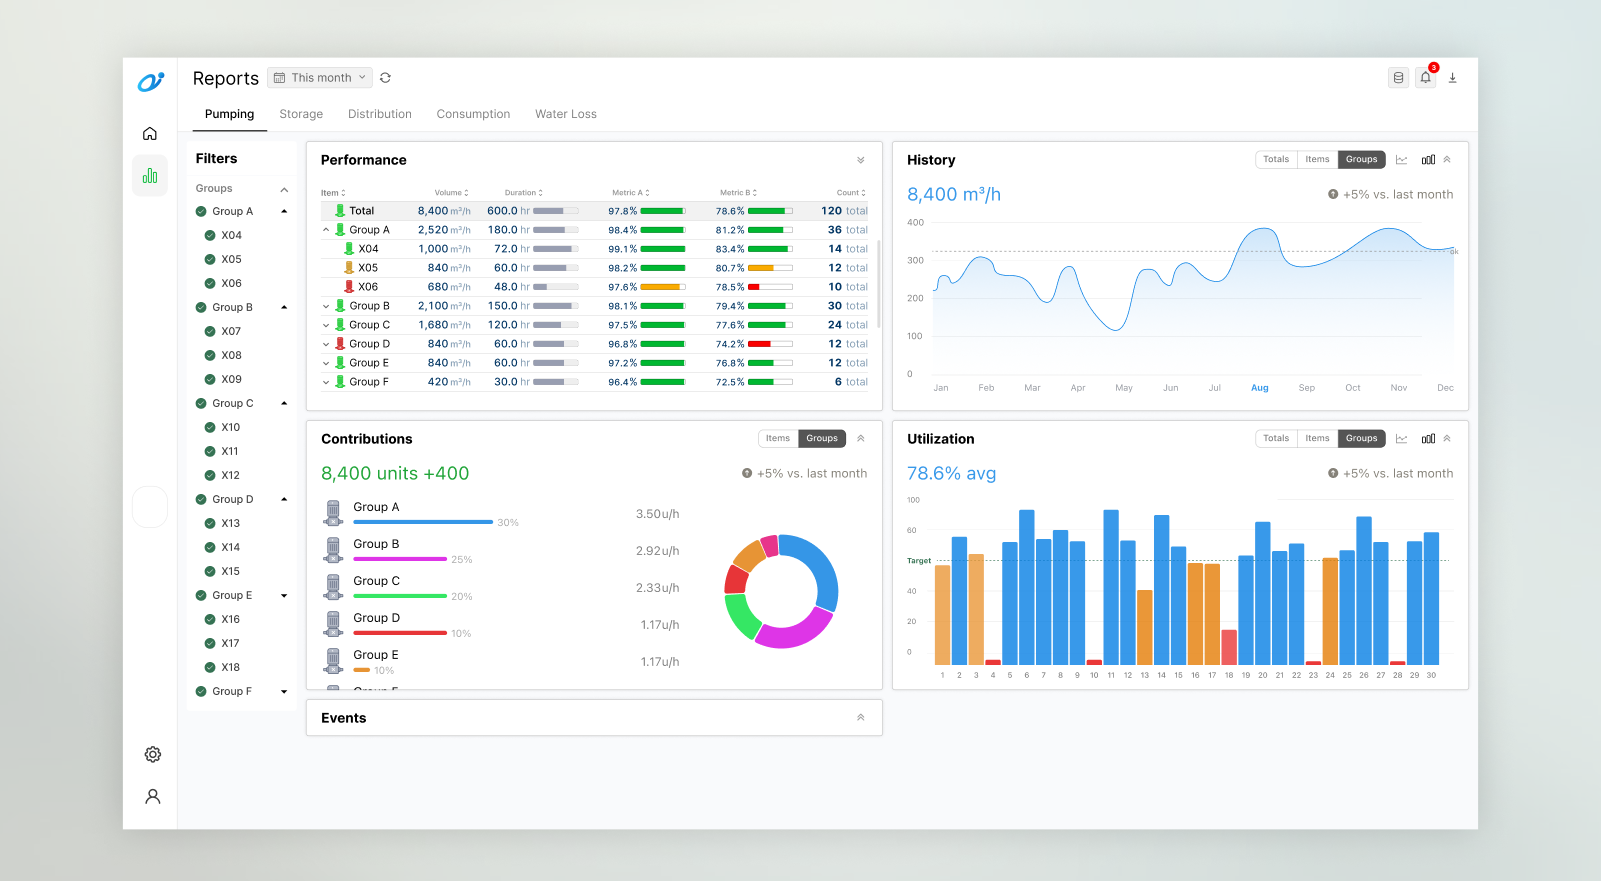
Once operational data was centralized, the platform could support comparisons across the entire network, from pump availability and utilization to storage trends, consumption, and water loss. Existing reports were reviewed first to establish which information operators already relied on and where additional analysis could add value.
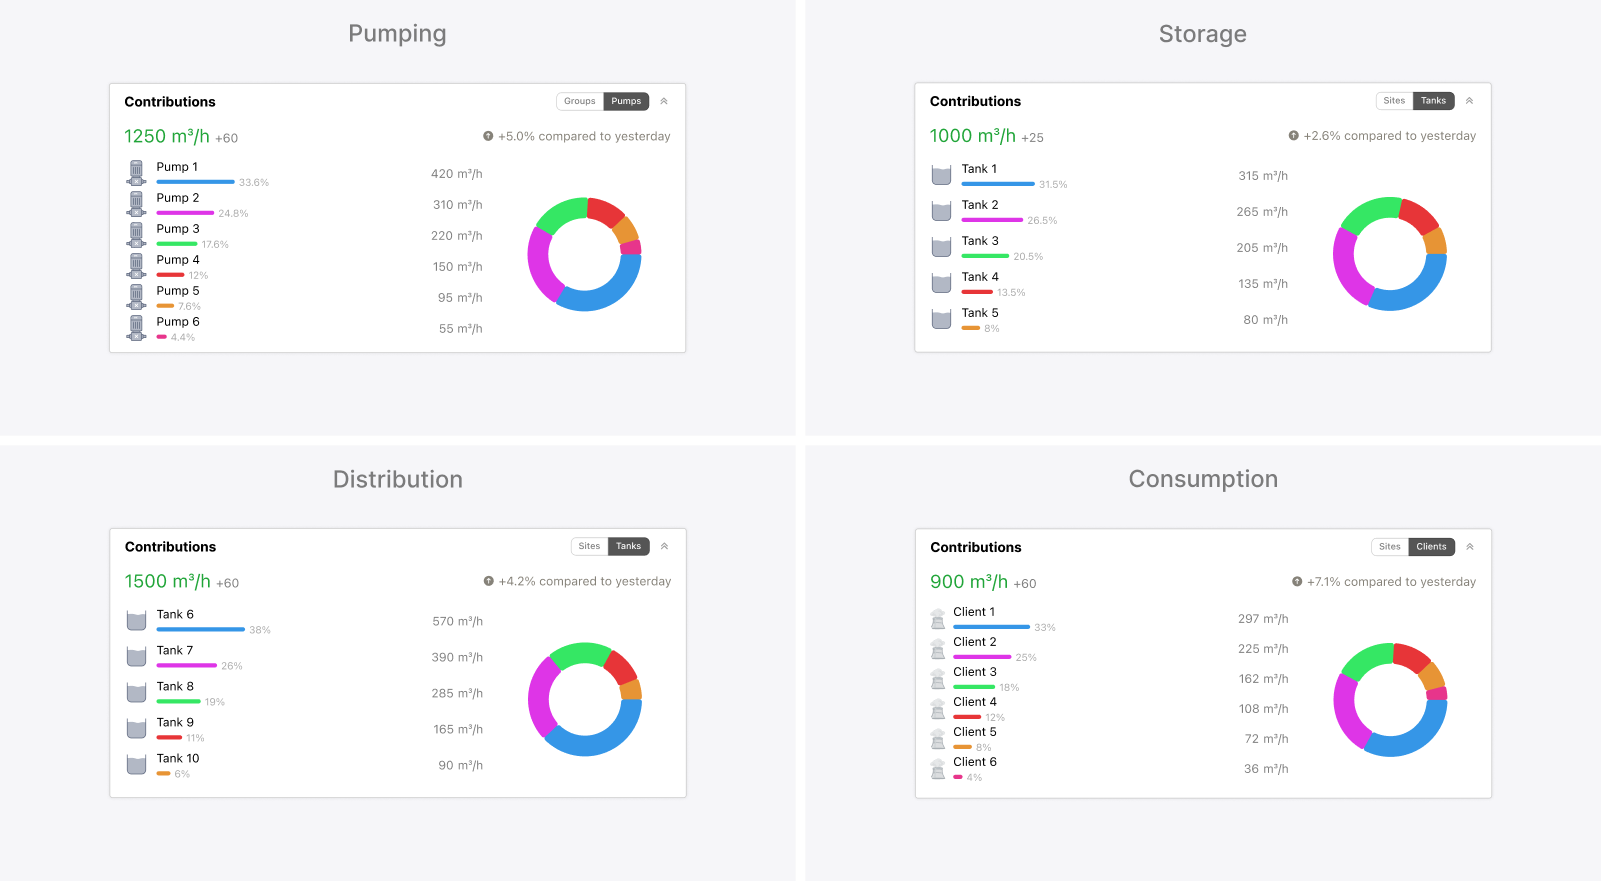
The challenge was to make that analytical depth intuitive within the project’s timeline. Several iterations explored the report selection, chart types, information hierarchy, and layout before the structure settled into five tabs for pumping, storage, distribution, consumption, and water loss. Each used the same arrangement of report cards and interaction patterns, although the measures and content changed with the subject. Detailed tables supported asset-level comparisons, while history, contributions, and period summaries offered complementary perspectives. Controls within the cards allowed operators to switch between totals, individual assets, and operational groups without requiring a separate report for each level.
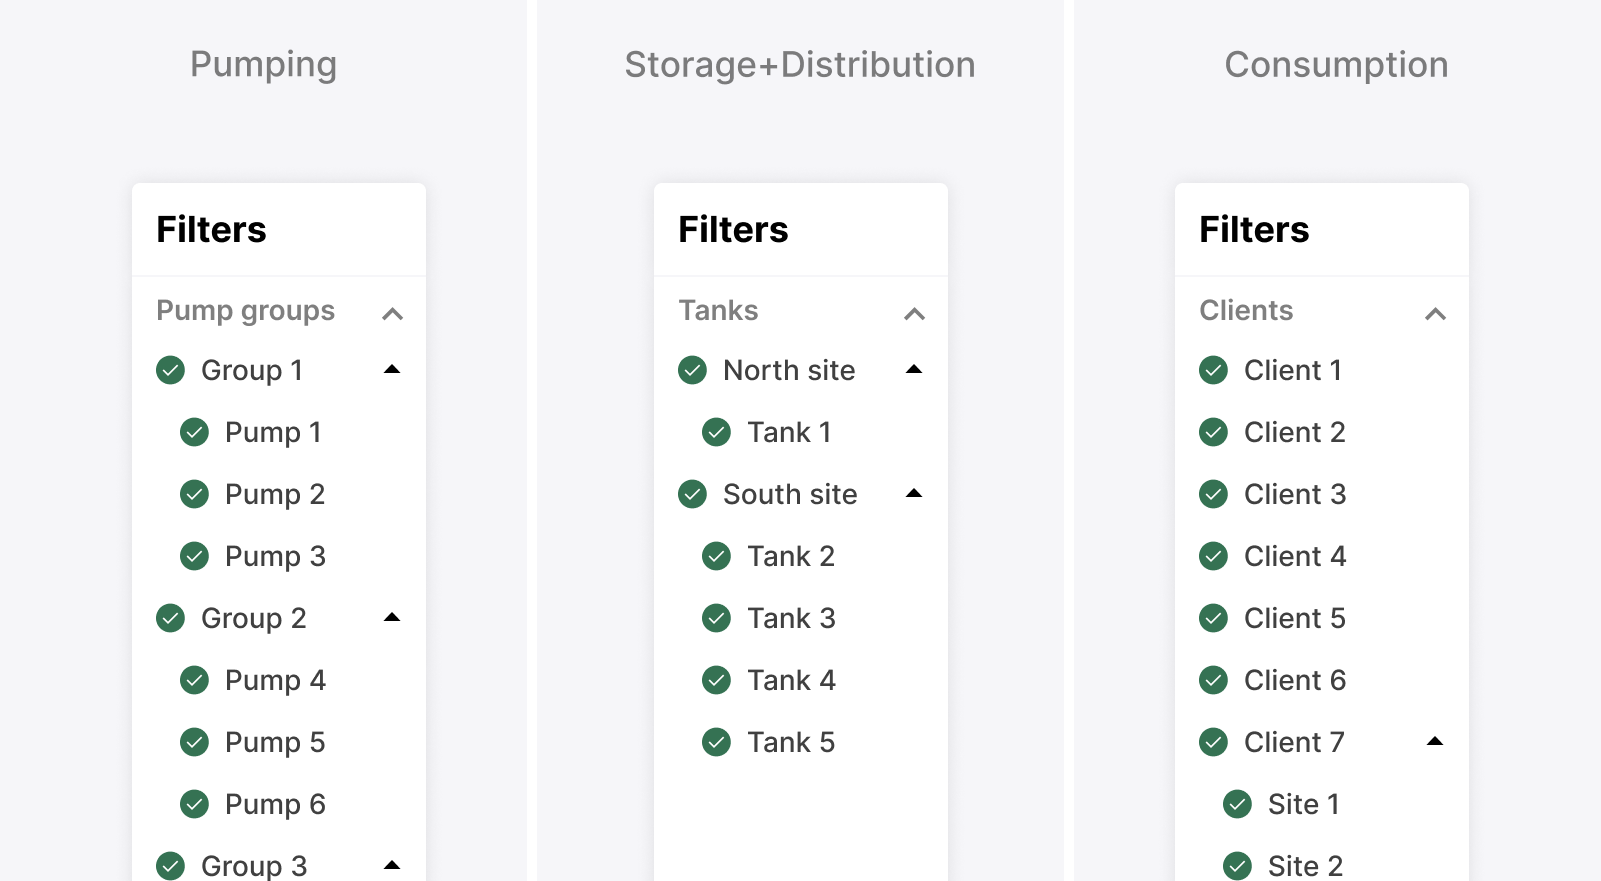
One part of this reporting structure proved harder to justify within the available scope. A hierarchical filter sidebar was explored so operators could narrow the reports to specific pump groups, tanks, or clients, but its value depended on consistent behavior across all five tabs and alongside each card’s grouping controls. That broader implementation effort exceeded what the deadline allowed, so the sidebar was deferred even though it offered a useful way to focus the analysis.
Modernizing shift reports without changing their templates
The reporting work took a different turn when some stakeholders reviewed the designs and explained that they did not reflect the reports they needed. Until then, “reports” had been understood as performance analysis, as it had been in similar projects, but these stakeholders were referring to the records operators completed at the end of each shift. Because both needs had been discussed under the same term, the difference only became clear once the designs gave everyone something concrete to react to. These shift reports followed established templates whose required content could not change within the project’s scope. Stakeholders were open to revisiting those practices later, but the immediate need was to support them within the platform. A dedicated shift-reporting flow therefore allowed operators to view the relevant readings and manually complete information that still required their input, such as instructions, manoeuvres, events, and anomalies.
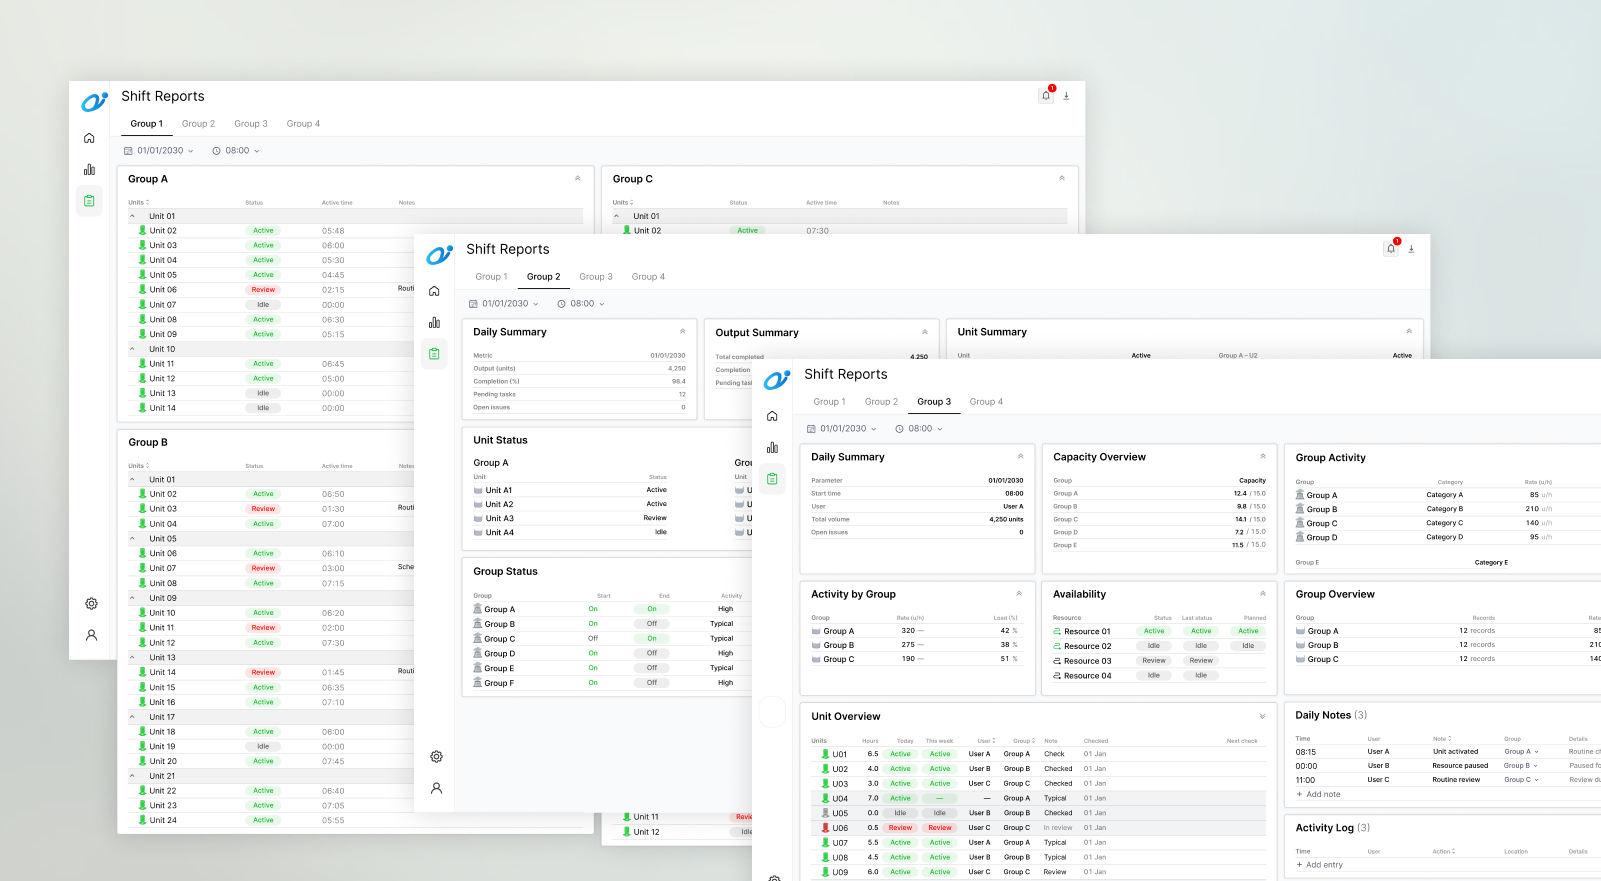
Four templates covered the different operational contexts, with the fields and sections of each preserved rather than forced into one universal report. The layouts reused card components that had already been built, which reduced development effort and provided a consistent presentation across station conditions, reservoir readings, client consumption, and pump availability. Where required by the original template, the reports also retained comparisons between the beginning and end of a shift.
