
Designing a Platform for Supply Chain Monitoring and AI-assisted Planning
A look at the UX process and some key decisions and tradeoffs behind designing a supply chain platform for a global manufacturing group. The case study covers operational monitoring, historical performance reporting, data visualization, and AI-assisted simulation and planning.
Note: This case study focuses on product thinking, systems design, and UX decisions. Selected examples use illustrative labels and values. The original platform was validated with domain experts to reflect the real supply chain.
Context & Role
I joined the project as the senior UI/UX designer to help transform this fragmented operational data into a centralized digital experience. My role was to lead the UX work for the platform, from understanding the operational domain and structuring the information architecture to prototyping and validating the core monitoring, reporting, and planning workflows. The initial goal was to create a single interface capable of representing the entire supply chain clearly and intuitively to allow decision-makers to reliably understand operational status, material flows, stock levels, production performance, and material transfers from a single source of truth. Once this was successfully implemented, the project expanded into a broader decision-support system that allowed users to track historical performance across the entire supply chain and run AI-powered simulations to anticipate future operational scenarios, identify risks, and support strategic planning.
Business Context & Problem
The client operates a complex supply chain spanning production, transformation, storage, transportation, and import/export operations. Because these operations were interconnected, a disruption or change in one area affected material flows, stock levels, production, and transfers across the network. Operational data was distributed across dozens of spreadsheets, making it difficult for managers to quickly understand the state of the supply chain, identify disruptions, or review performance across the network. The core challenge was turning fragmented, spreadsheet-based operational data into a shared source of truth that could make supply chain status, disruptions, performance, and future scenarios understandable at a glance.
Solution & Impact
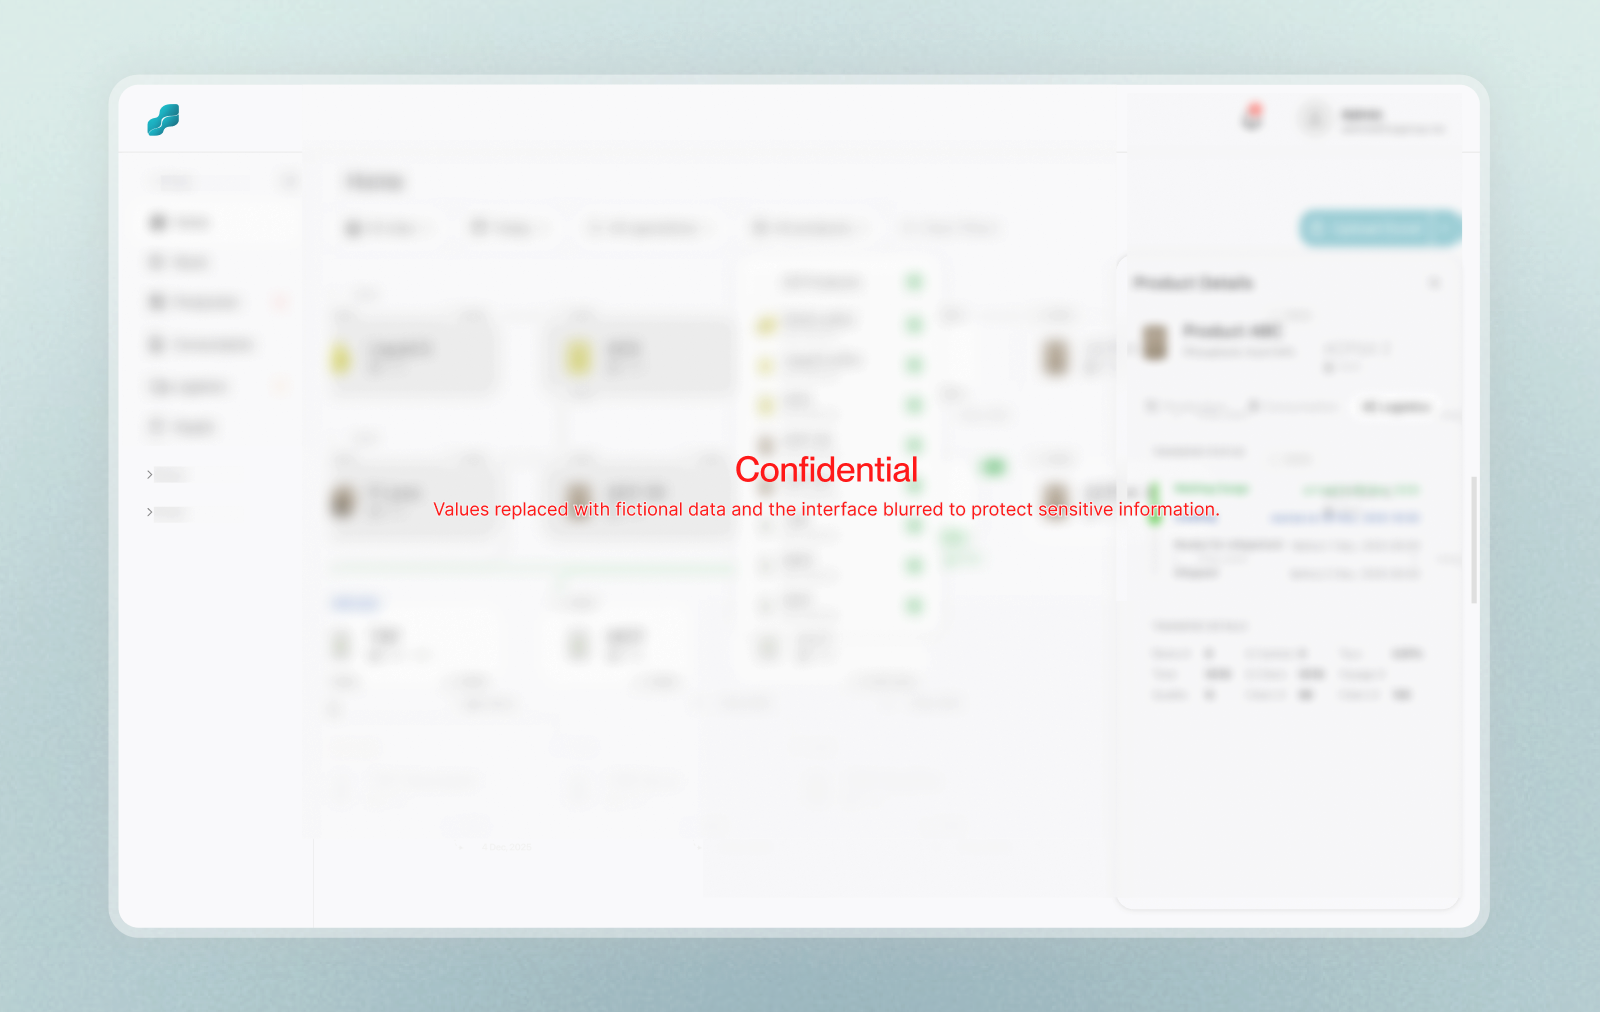
The platform brought operational monitoring, historical reporting, and AI-assisted planning into one shared environment. Its central visualizer translated the supply chain into an interactive flow, allowing users to understand material movements, stock levels, production activity, and potential disruptions across the network. Users could focus on specific sites, review past operational states, investigate individual parts of the chain, and access detailed reports when deeper analysis was required. As the operational visualizer matured and was positively received, the project expanded beyond its initial monitoring scope. Historical reporting was introduced to help teams understand performance over time, while AI-assisted simulations and recommendations added a forward-looking layer for exploring operational scenarios, identifying potential risks, and supporting planning decisions. The platform was adopted and is now used within operations. Its continued use and expansion into reporting, simulation, and planning workflows are encouraging signals of practical value. However, its effect on decision-making speed, disruption response, and manual reporting effort was not formally measured, so these benefits cannot yet be quantified.
Domain Understanding, Research, & Validation
The project developed in a fast-paced B2B environment where the team needed to make progress while the product scope and research approach were still evolving. When I joined, the initial requirements and product direction had already been established, and my direct access to end users was limited during the early conception and design phases. Initially, much of the operational context came through the project manager and stakeholders representing users. They translated user and business needs into functional requirements and brought a strong understanding of the supply chain and its operational challenges.
To complement this input, I invested significant time in understanding the domain directly. I analyzed spreadsheets, operational reports, and existing workflows, and worked closely with the project manager, engineers, and domain specialists to reconstruct the logic behind the supply chain. This allowed me to form working models of how users might understand and interact with the platform, which I treated as assumptions to be tested rather than confirmed user behavior. Later in the project, I met directly with a small number of operational managers who validated many of the mental models developed during the earlier work but also revealed gaps and edge cases that required further iteration. Because these managers represented only part of the platform’s eventual user base, some workflows still relied on domain evidence, systems thinking, and inferred behavior rather than direct research with every user group.
Throughout the project, technical, operational, and UX perspectives were brought together to challenge and refine the product direction. When a requirement could be addressed in different ways, I used prototypes to make alternative UX directions concrete and easier to evaluate. In several cases, users strongly preferred these alternatives once they could interact with them directly. The project became an important reference point internally for the broader role UX could play, not only in refining interfaces, but also in structuring operational systems, simplifying complexity, and informing product decisions.
Key Decisions & Tradeoffs
Developing the operational monitoring experience
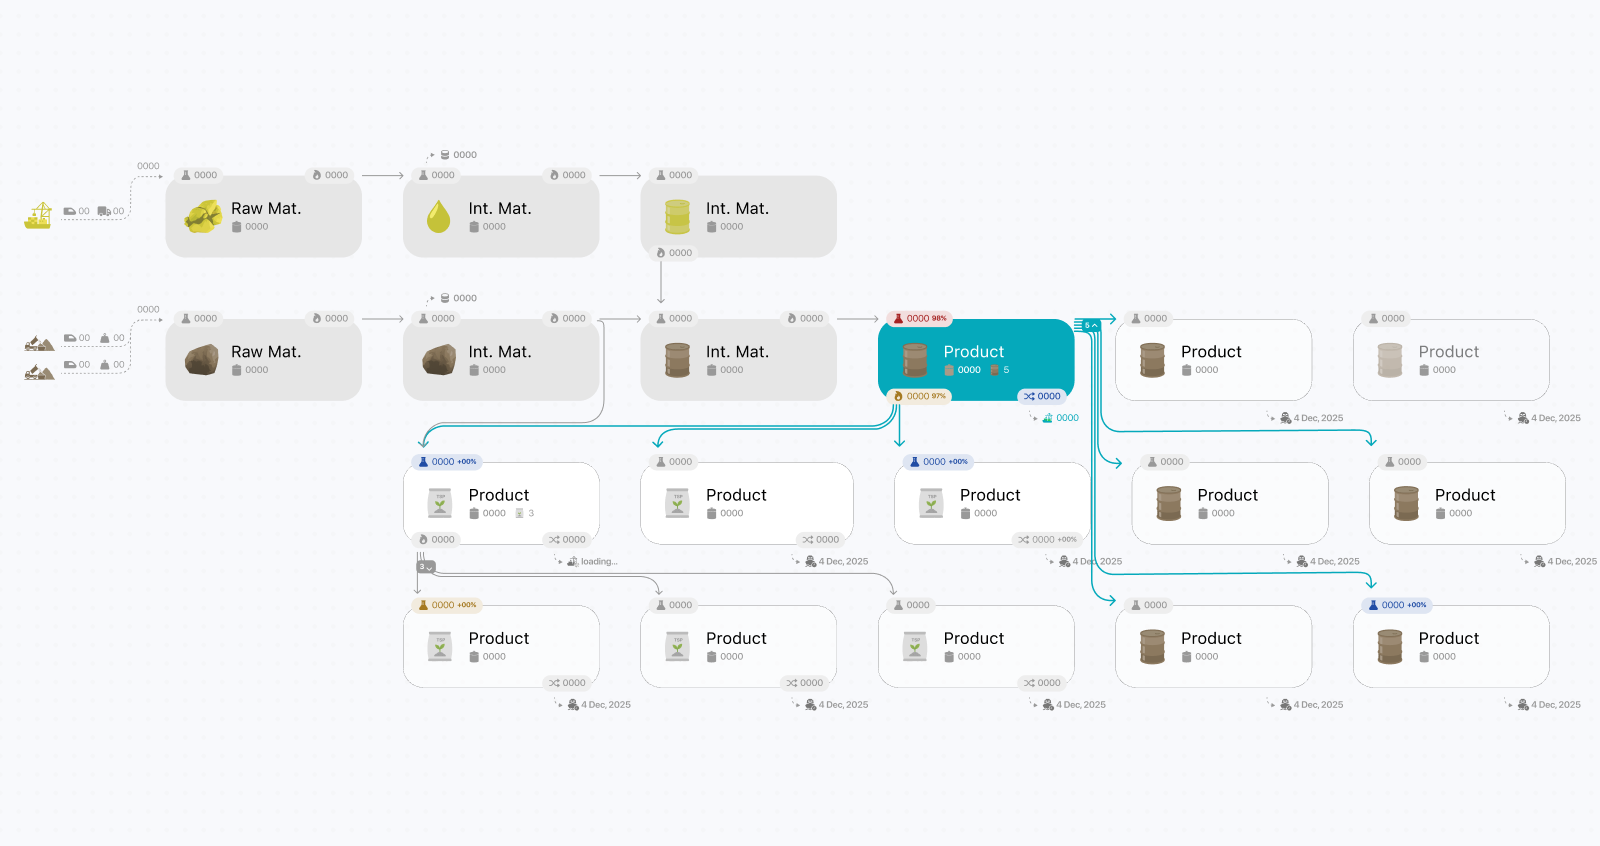
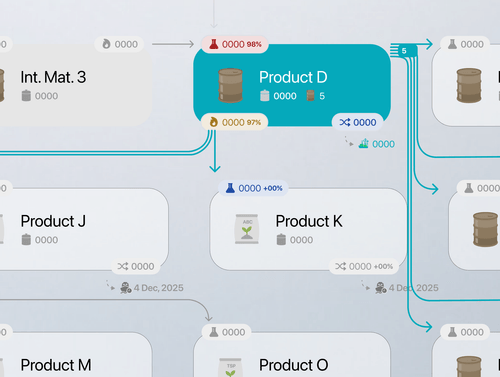
The choice to build the platform around an operational flow view was already locked in before I joined the project. A major stakeholder had previously seen a similar visualizer in another product and specifically requested a comparable approach instead of a traditional dashboard or reporting interface, and the tight timeline made it difficult to properly explore alternative directions for representing everything within a single interface. My biggest concern was whether the approach would remain scalable once we learned more about the chain and as new requirements emerged, particularly since the initial goal was to monitor the entire supply chain through a single interface with minimal navigation. Fortunately, the operational visualization approach proved to be highly effective at representing the full supply chain and made it possible to intuitively highlight disruptions and their downstream impact. As the platform evolved, the view became more interactive through site filters for focusing on a specific site and contextual drill-downs that revealed additional details in overlay panels when interacting with individual nodes. This created the illusion of a single-view experience, even though the platform progressively revealed multiple layers of information through overlays, filters, and contextual interactions rather than traditional navigation patterns.
Reducing complexity through a common operational model
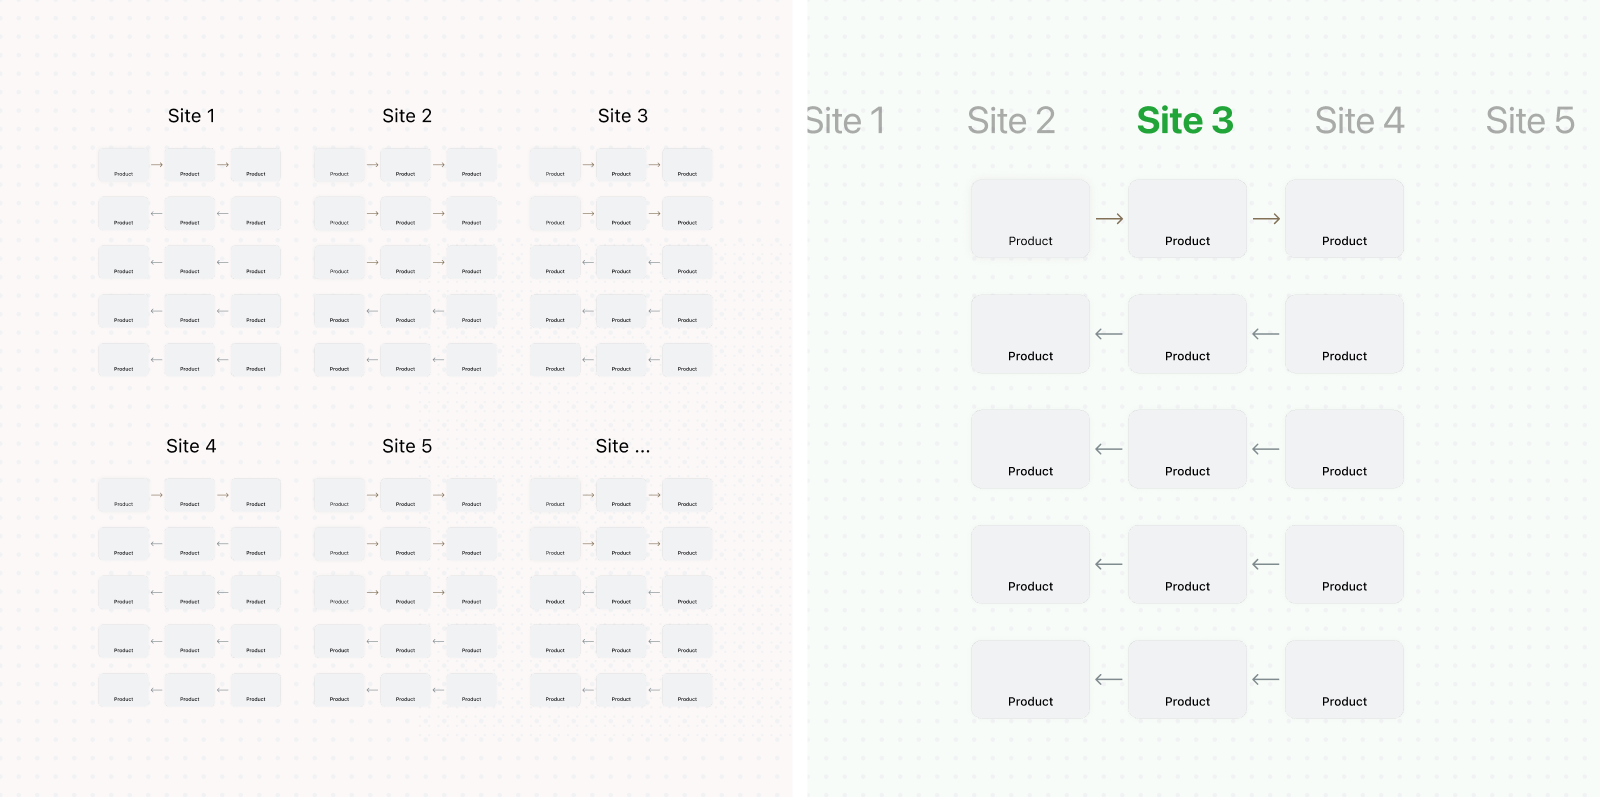
An early direction represented every operational step at every site as a dedicated card, even when several sites followed nearly identical processes with only minor differences. Although technically comprehensive, this produced an intricate diagram containing intersecting arrows, dozens of cards, and hundreds of constantly changing values. During reviews, the visualization proved difficult to interpret, even for managers who generally valued information density. I identified the common operational flow shared across sites and represented it once rather than duplicating it for every location. Site-specific differences could then be accessed through quick filters. This substantially reduced repeated nodes and connections and gave users a more consistent model of the overall supply chain. The tradeoff was that inter-site material transfers became harder to represent naturally within the shared flow. Because these transfers were relatively infrequent exceptions rather than primary operational paths, I recommended handling them separately instead of adding permanent complexity to the main visualization. During validation, the simplified flow and custom operational icons were immediately recognizable to users familiar with the supply chain. The visualization was later also used internally to explain the operational model to newcomers and non-specialized stakeholders.
Improving scanability through semantically coded icons
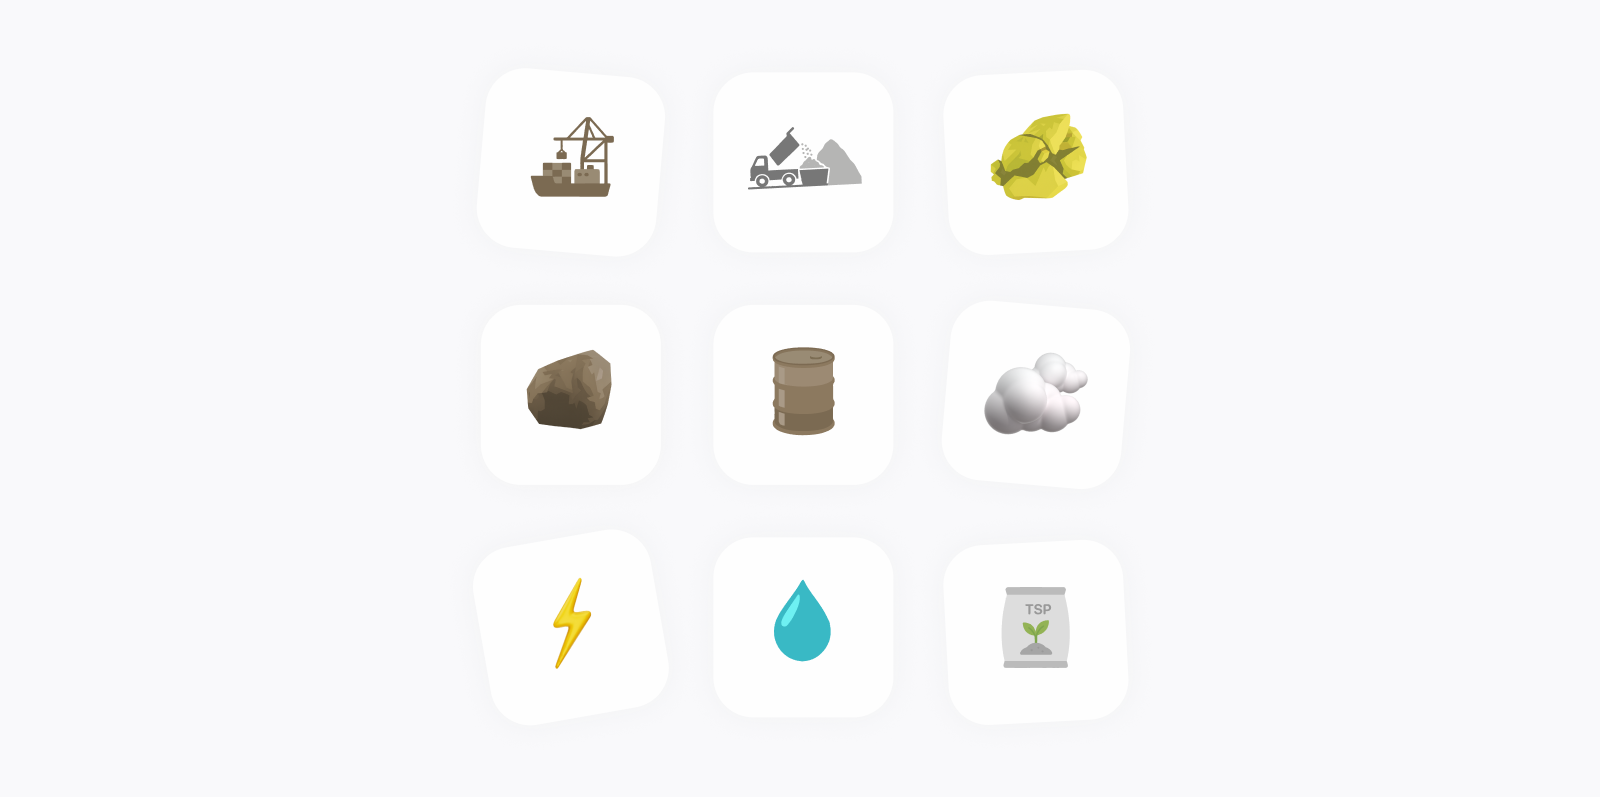
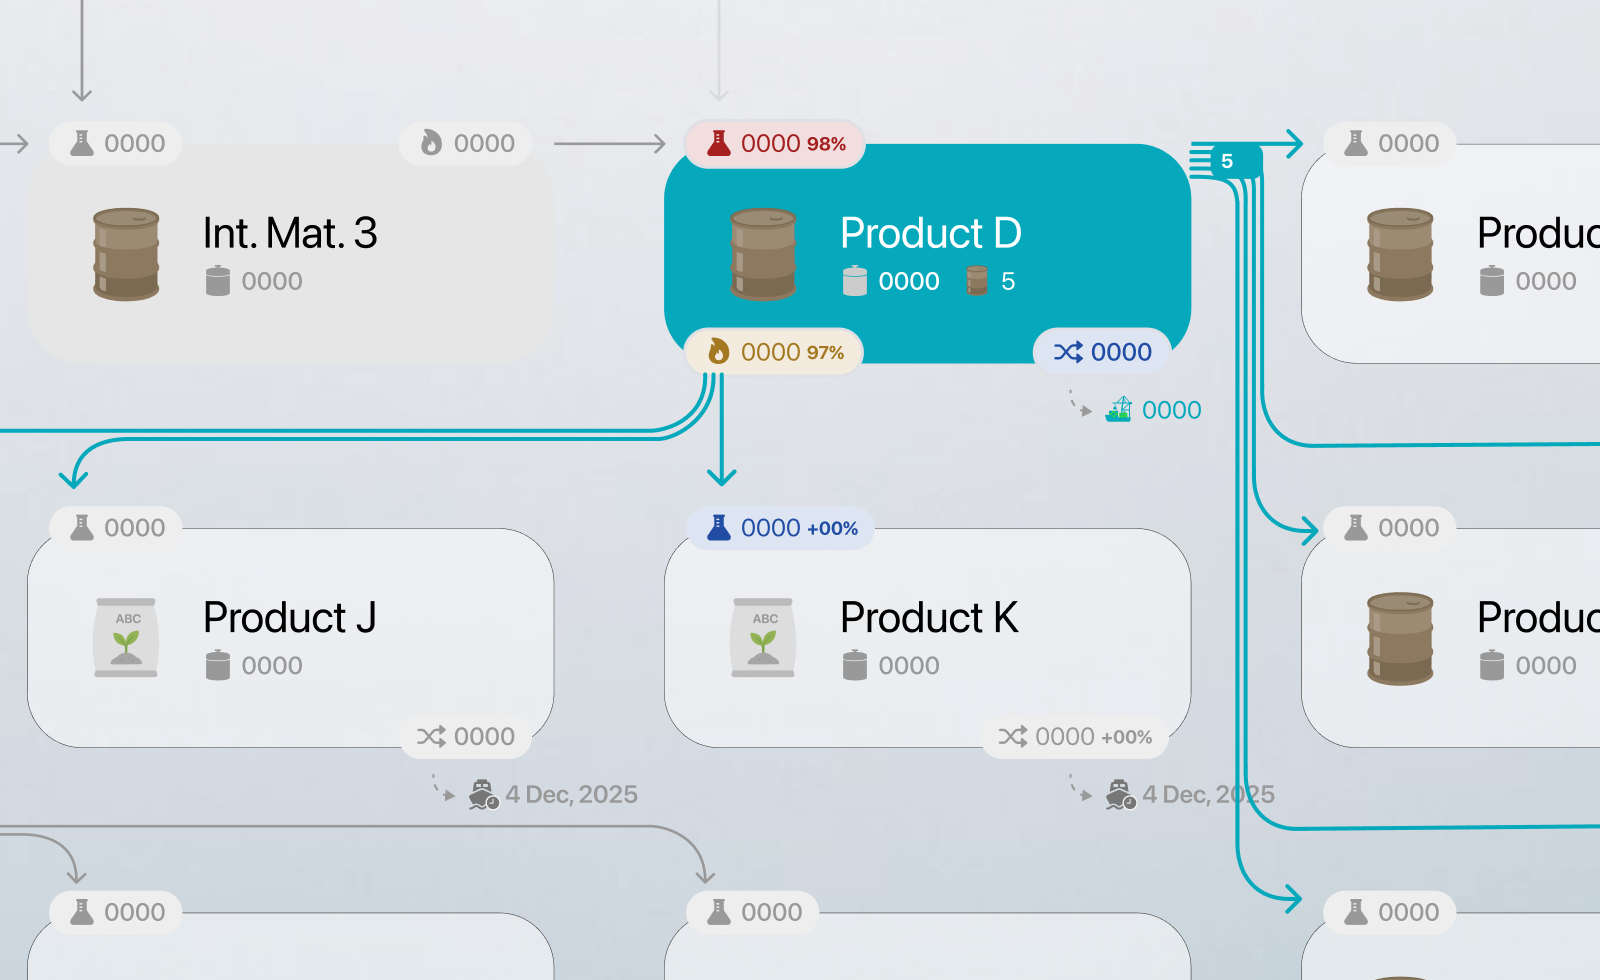
Relying on labels alone made the operational visualization difficult to scan and required users to repeatedly read each card to understand the flow. I therefore pushed for custom icons to become a functional part of the system rather than a decorative addition. The icons were designed to reflect the products, operations, and material categories used across the supply chain. They followed a shared visual language, while color provided an additional layer of meaning by remaining consistent with the material types used throughout the interface. Related product families shared similar structures, allowing users to recognize their relationship, while labels distinguished the specific products. After visiting operational sites and seeing some of the materials and processes firsthand, I refined several icons to better reflect their real-world counterparts.
Producing a large and coherent icon set within the available timeframe required a pragmatic workflow. Generative AI was an emerging option for icon development, but consistency across a full set still required careful refinement. I used operational references and AI-assisted explorations to generate initial directions, then manually refined the selected concepts into a minimal and consistent style, converted them into editable SVGs, and finalized them in Figma. This approach helped accelerate production while maintaining the consistency and domain specificity the system required.
Structuring the operational flow through hierarchy and layout
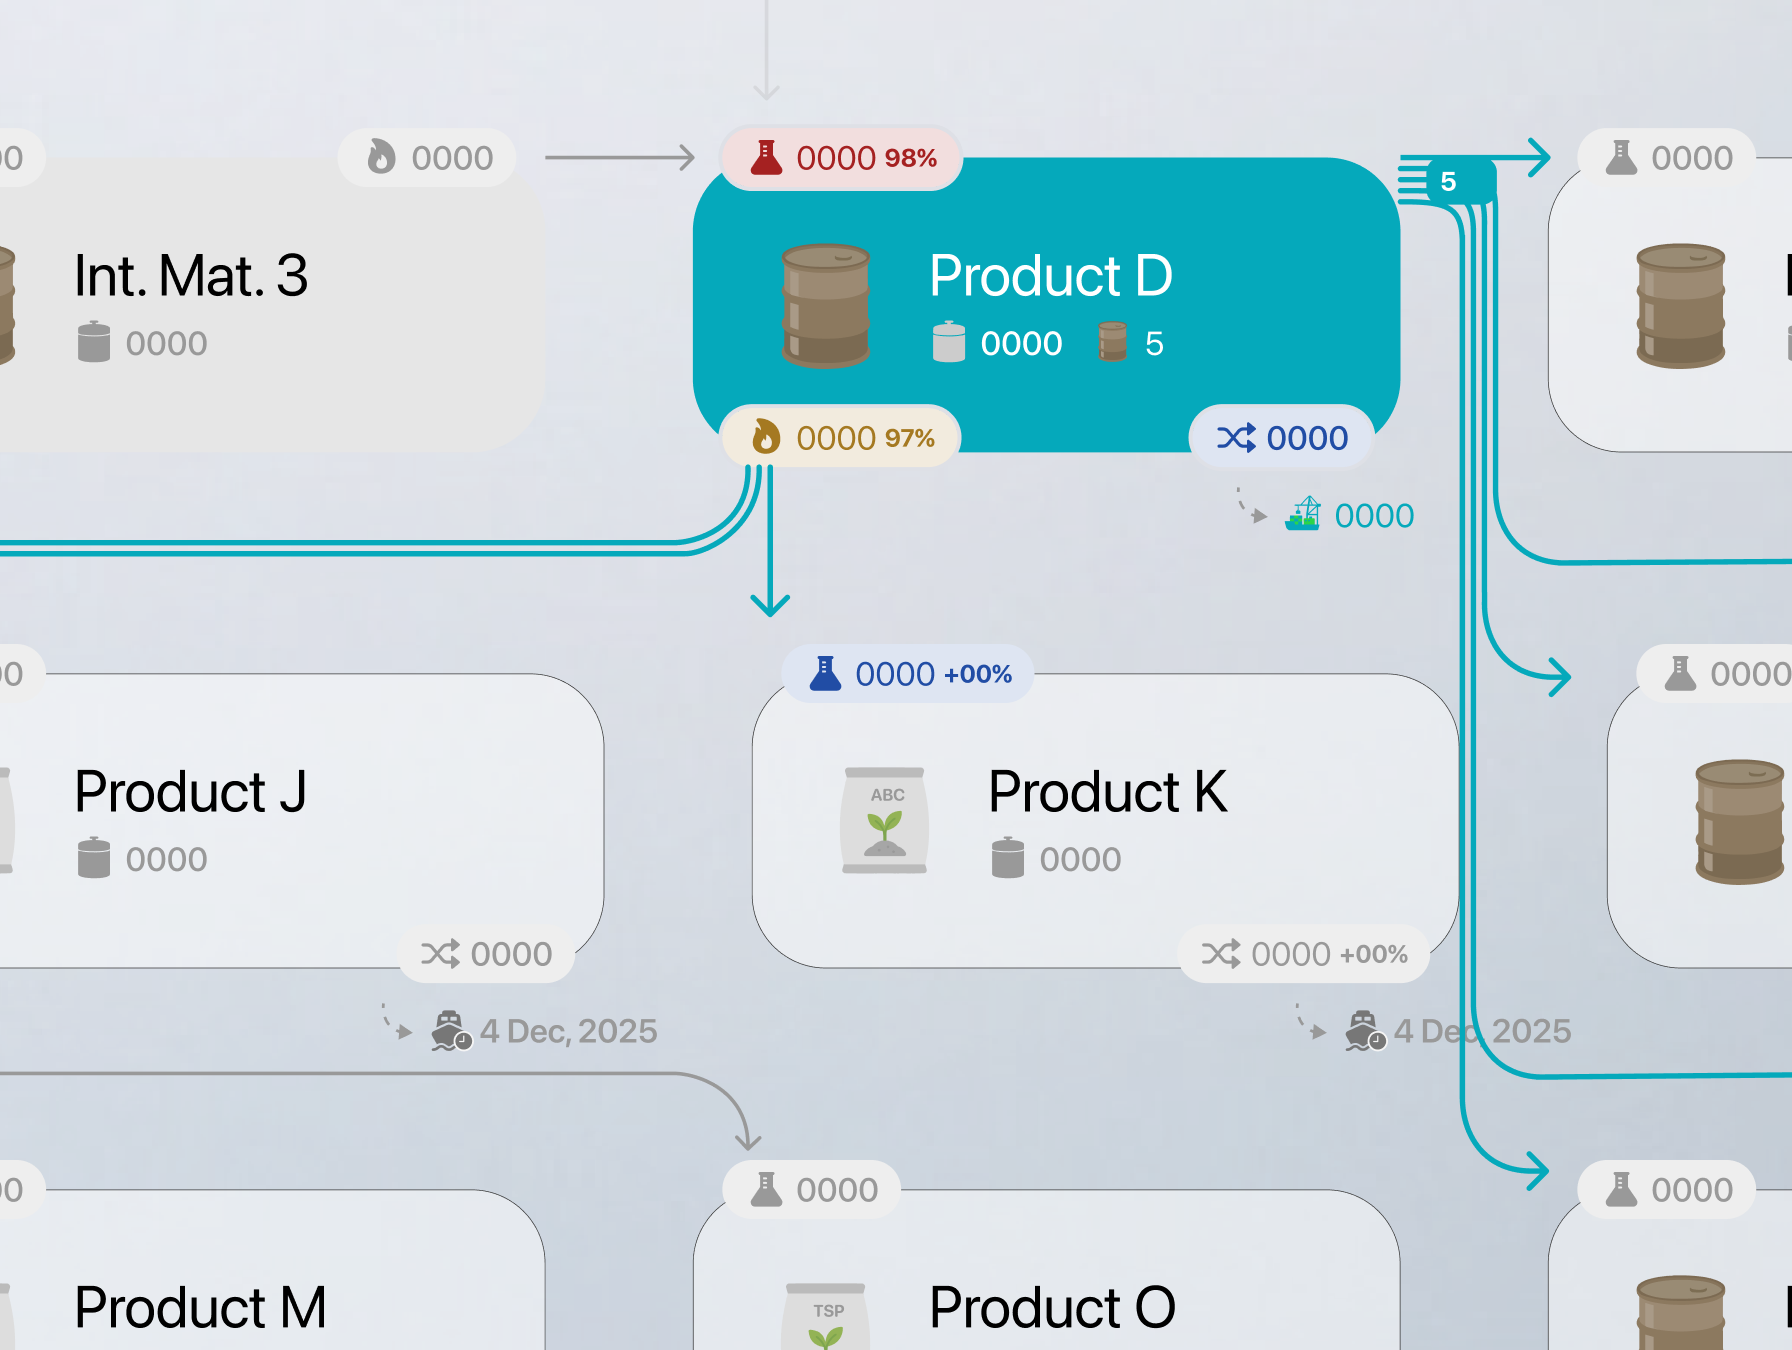
Once the shared operational flow had been defined, the next challenge was deciding how to structure it visually. Should every step use the same type of card? Should the flow move horizontally, vertically, or across multiple rows? Because the platform needed to display a large amount of interconnected information within conventional screen sizes, where and how the flow changed direction had to be intentionally designed rather than left entirely to responsive behavior. Two decisions helped make the visualization easier to understand. The first was differentiating material-related nodes from operational steps. Materials were represented as prominent white cards containing their key information, while operations used smaller, lighter elements without a background. This created two levels of visual hierarchy, allowing users to follow the progression of materials at a glance or focus on the individual operations between them when needed.
The second decision was organizing the flow into three horizontal sections. Each represented a broader stage of transformation already recognizable within the supply chain: initial production, secondary transformation where intermediary products were combined with other materials, and final transformation. This segmentation had not been formally specified by stakeholders. It emerged through layout exploration and aligned with how teams already understood the operational chain. I initially positioned the nodes within a controlled grid to maintain consistent spacing, sizing, and visual balance.
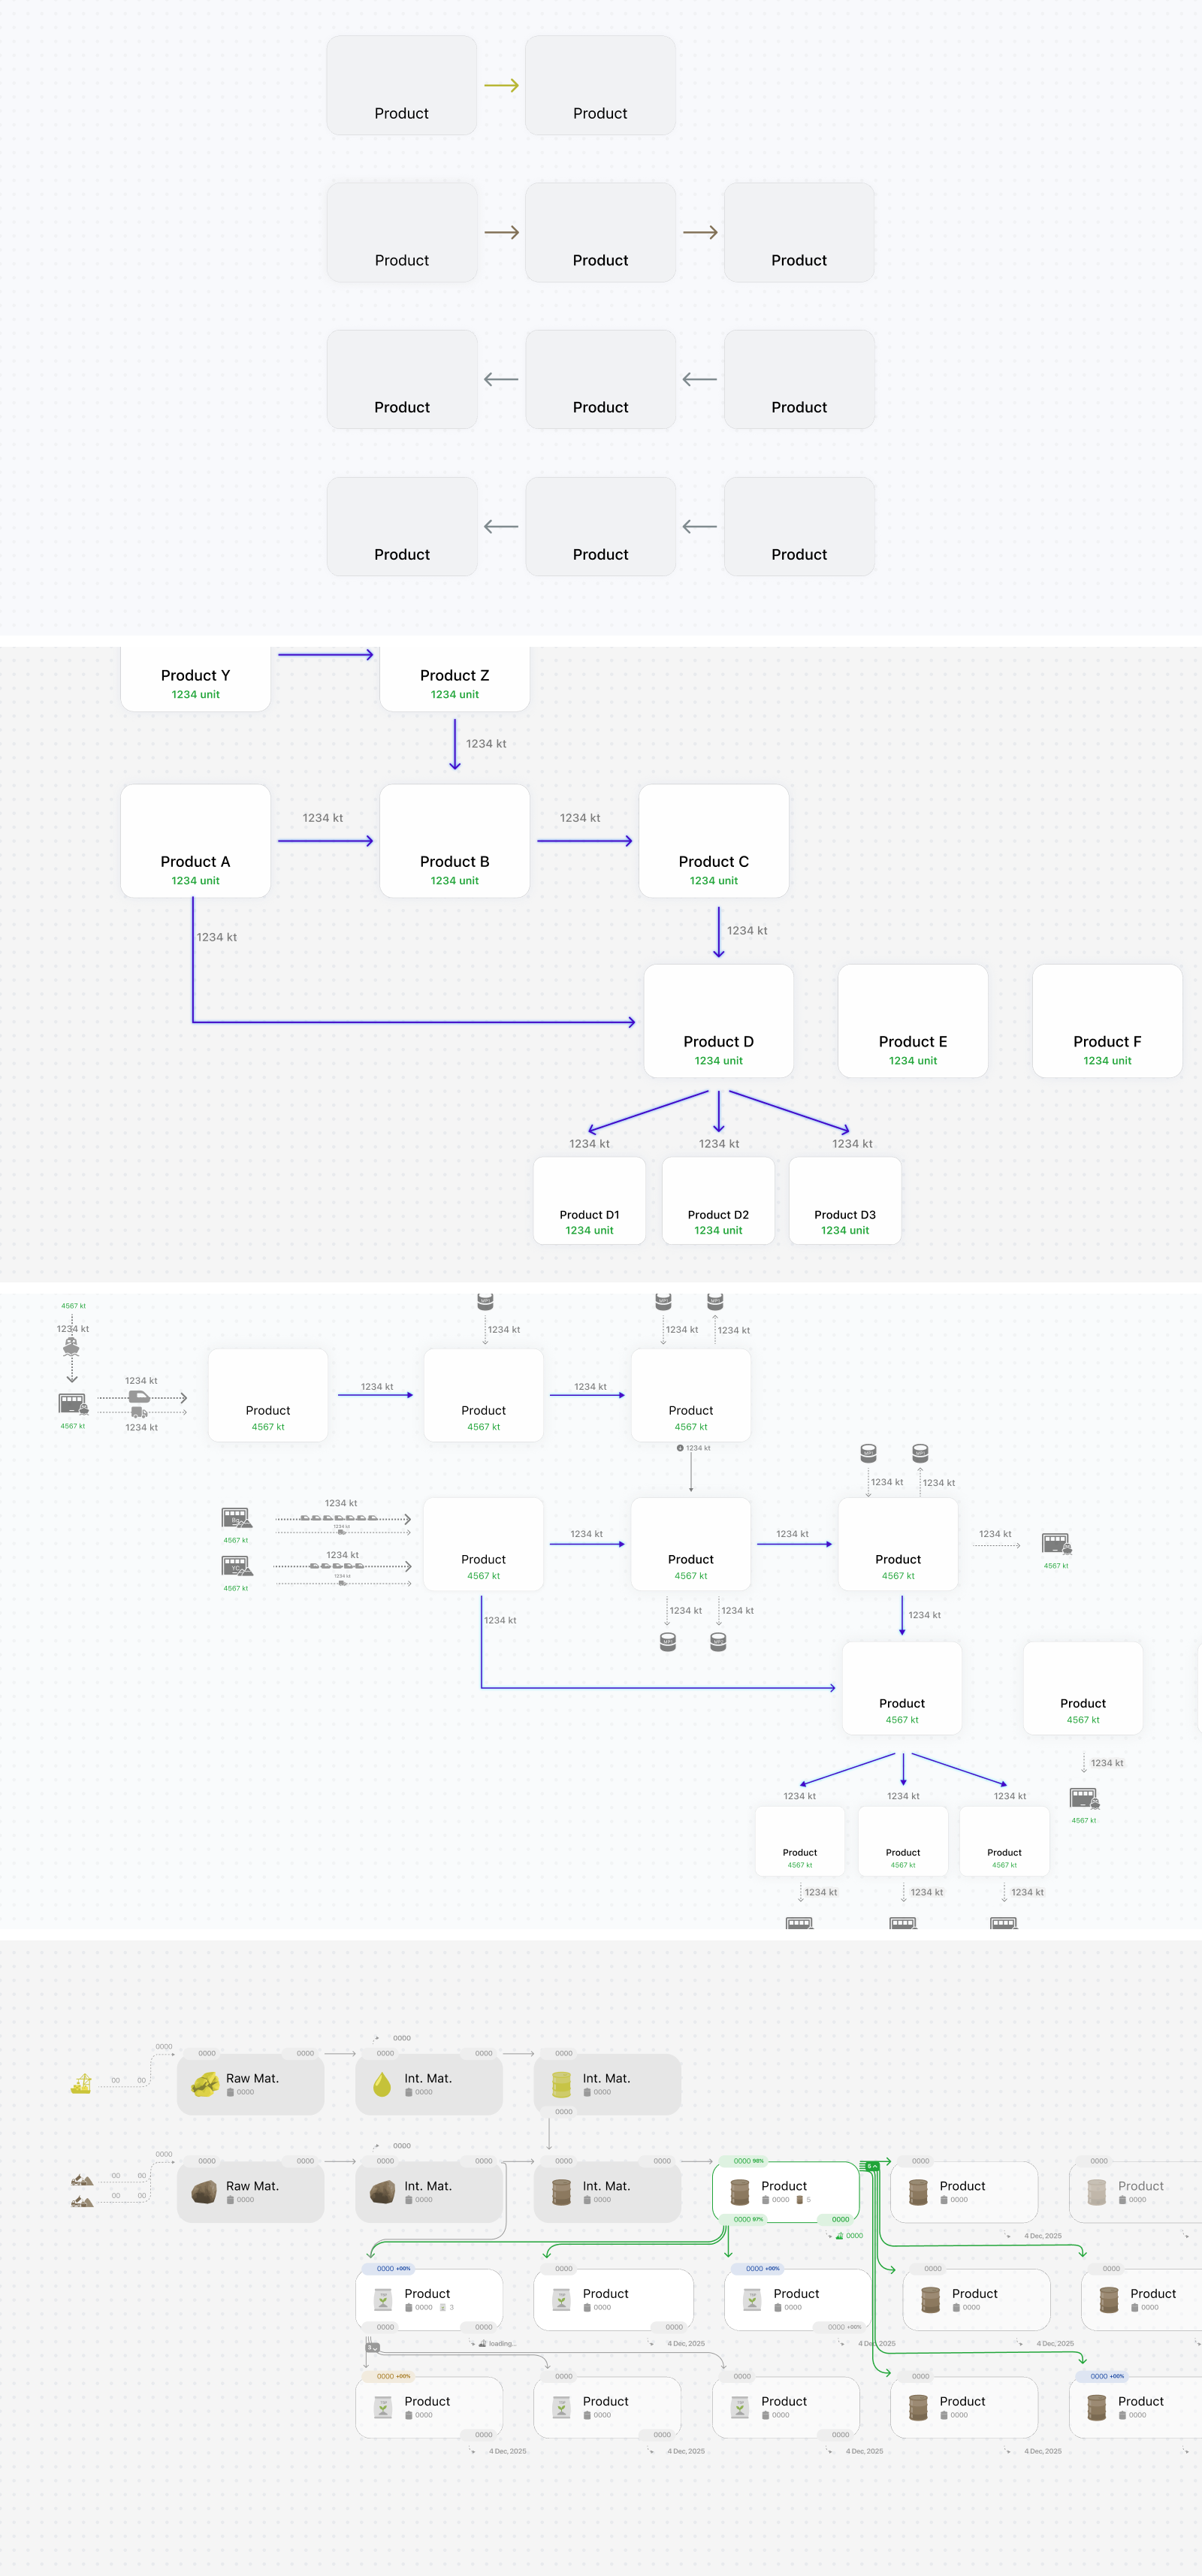
Within this structure, each material card also needed to present four recurring operational values: production, consumption, stock, and transfer. I explored several arrangements before assigning each value a predictable position. This allowed users to know where to look without repeatedly scanning the entire card. These values were initially displayed as colored tags connected to corresponding flow arrows. Matching the tags and arrows helped users follow operational relationships and understand how materials moved through the supply chain. At transitions between rows, some connections became less visually natural. I explored repositioning individual tags to better align with their arrows, but rejected this because it weakened the positional consistency users relied on across the rest of the visualization.
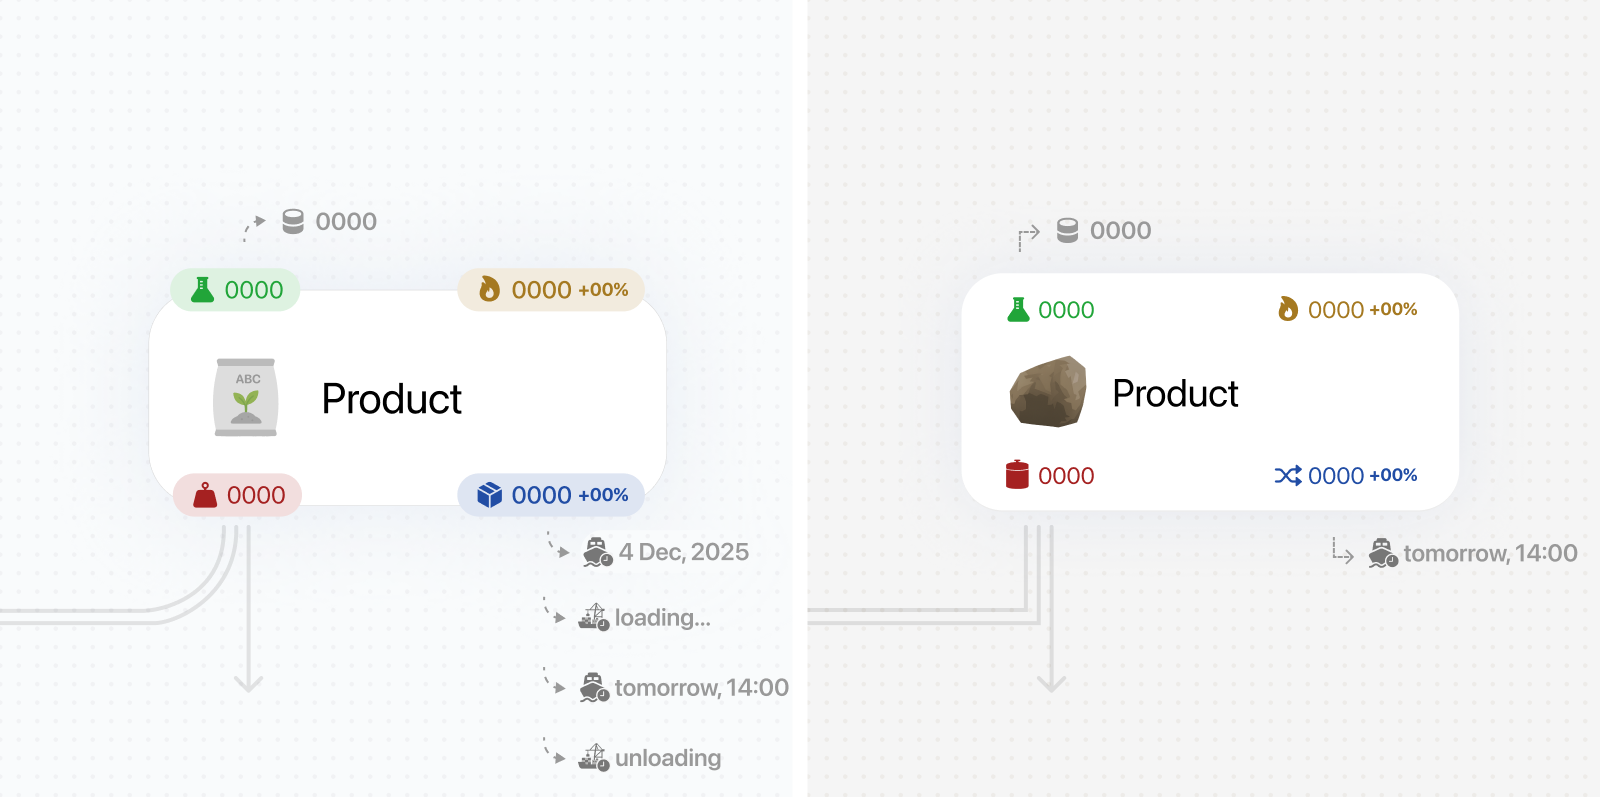
The original design used a controlled grid, nested metric tags, and arrows connected to specific values. During implementation, the visualization was rebuilt using React Flow, giving nodes more positional flexibility but making some of the original connections difficult to reproduce cleanly at scale. We simplified the metric tags into values embedded directly within the cards and moved from value-to-value connections to a more generalized card-to-card model. Although this reduced some of the visual specificity of the original concept, it preserved the overall hierarchy and made the visualization more feasible to maintain.
Balancing interaction depth with navigation simplicity
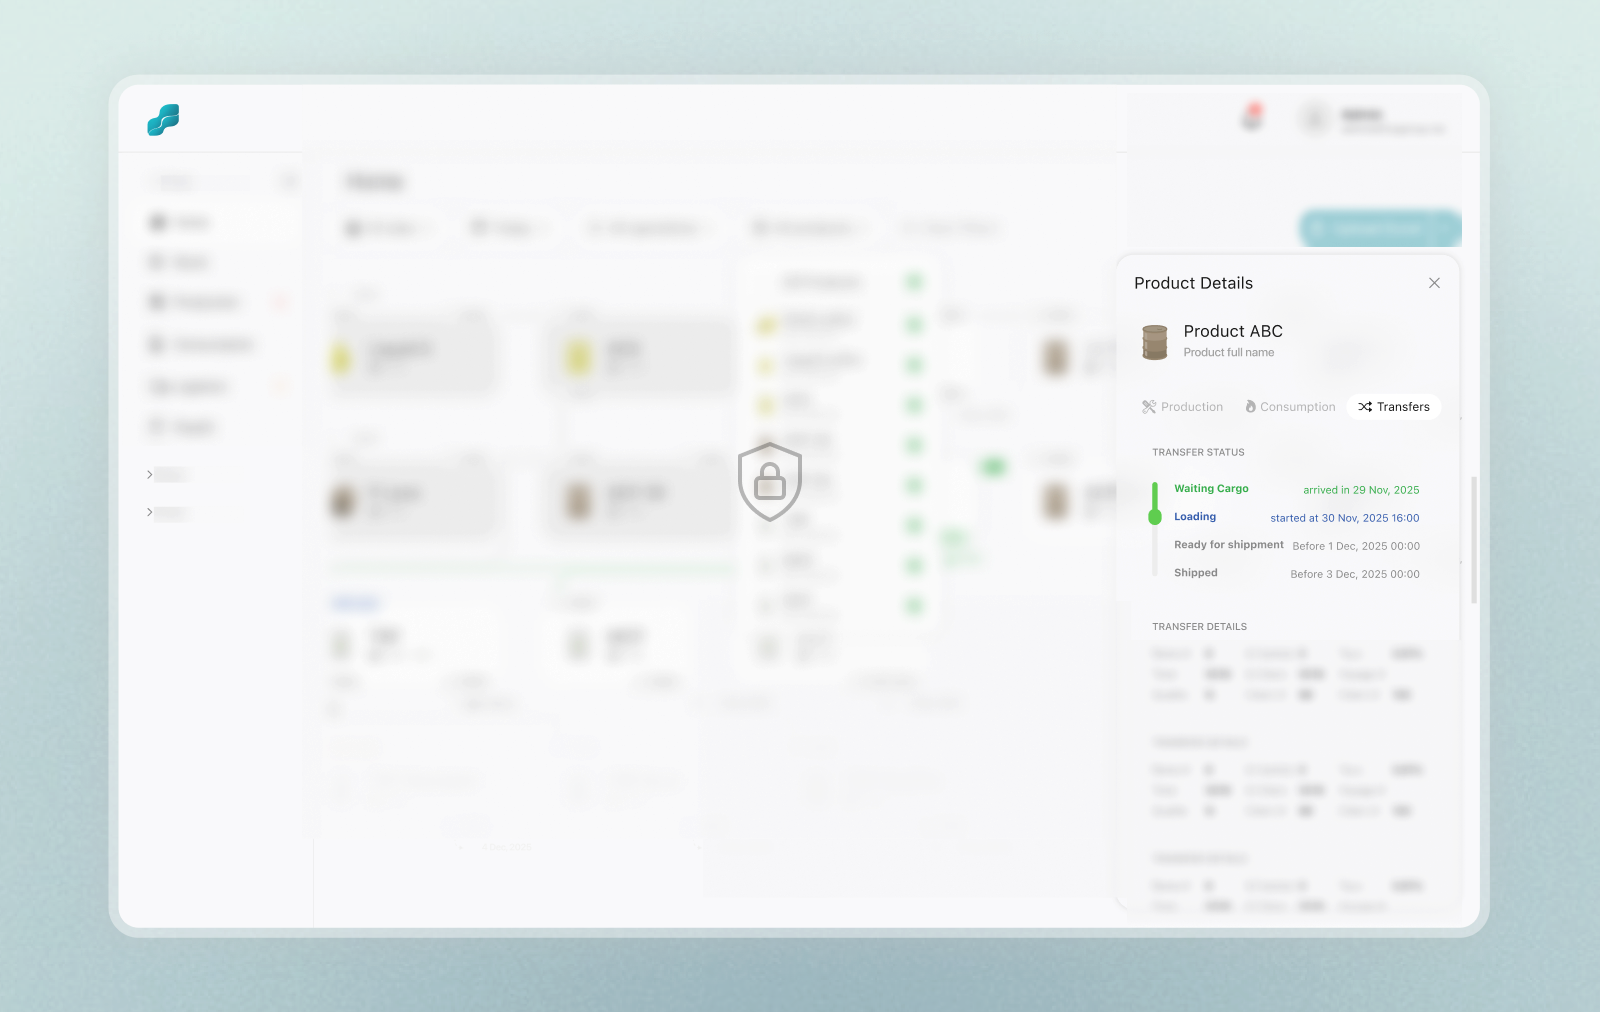
What started as a static operational visualization gradually evolved into a more interactive system without breaking the single-view experience. A date filter was introduced to navigate historical snapshots. Hover interactions were added to highlight specific operational paths while fading unrelated flows. Users could click on cards to reveal additional operational details such as stock, production, consumption, and transfer reports for each material through contextual overlays instead of full navigation. Site filters were also introduced to focus on specific operational areas, which later became useful for permission management since some users only had access to their own sites. Additional filters for operations and products were explored as well, but were ultimately removed because they added unnecessary complexity and required additional development effort without providing enough value.
Expanding from monitoring to dedicated reporting
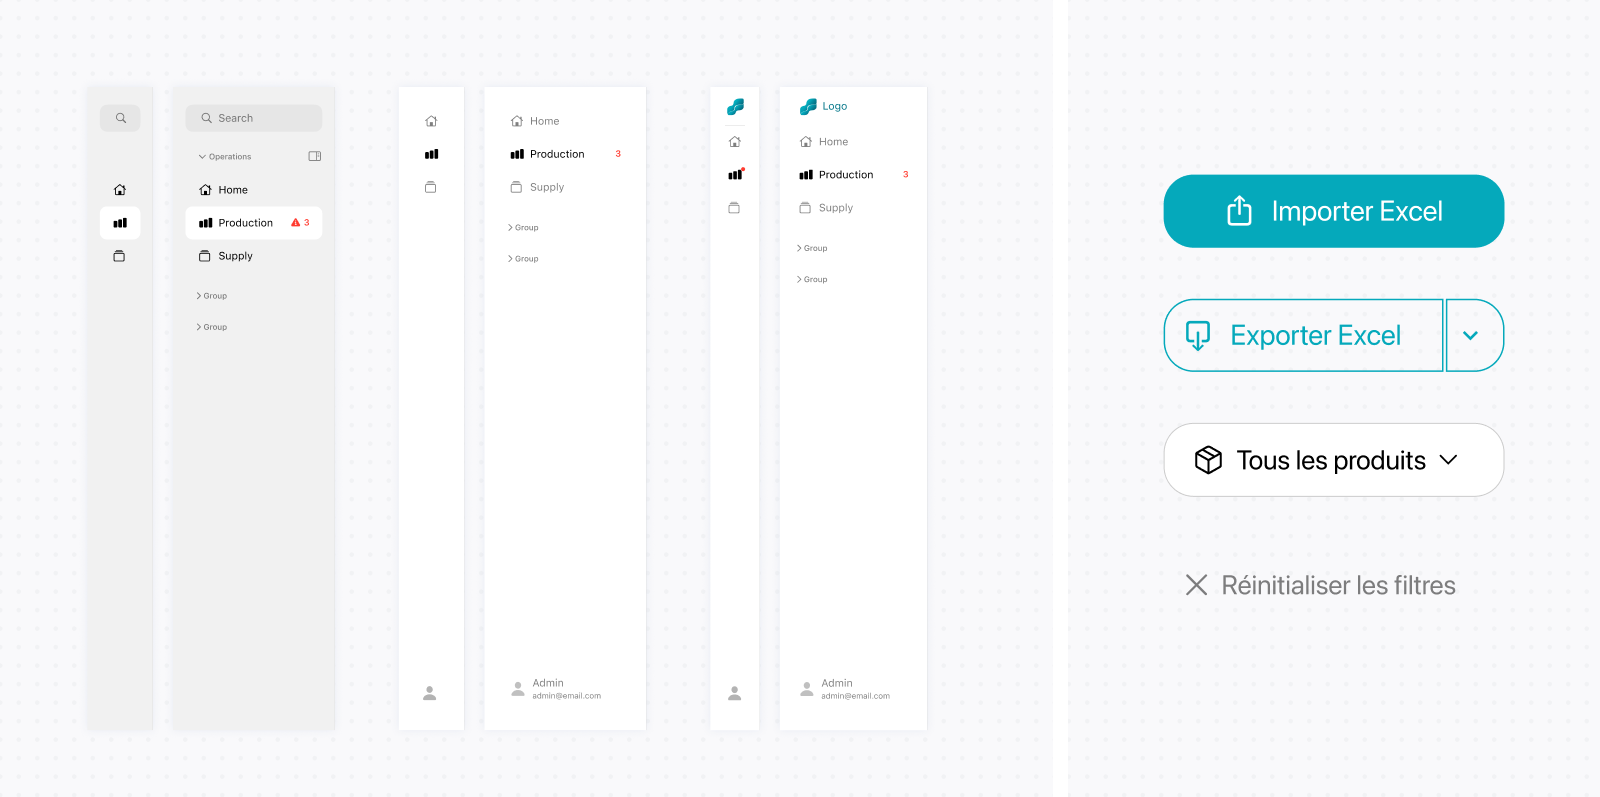
Once the operational visualization matured, it became clear that the detail overlays alone were not sufficient for historical analysis and reporting. This led to introducing a dedicated reporting experience alongside the operational visualization. The initial direction grouped stock, production, consumption, and transfer reports within a single page, with local tabs for switching between them. As the platform expanded, these report types moved into the sidebar as dedicated views. Each view retained the site comparisons and contextual controls needed for analysis. This gave reporting a clearer place within the wider platform and supported more scalable navigation without changing how users compared performance across sites.
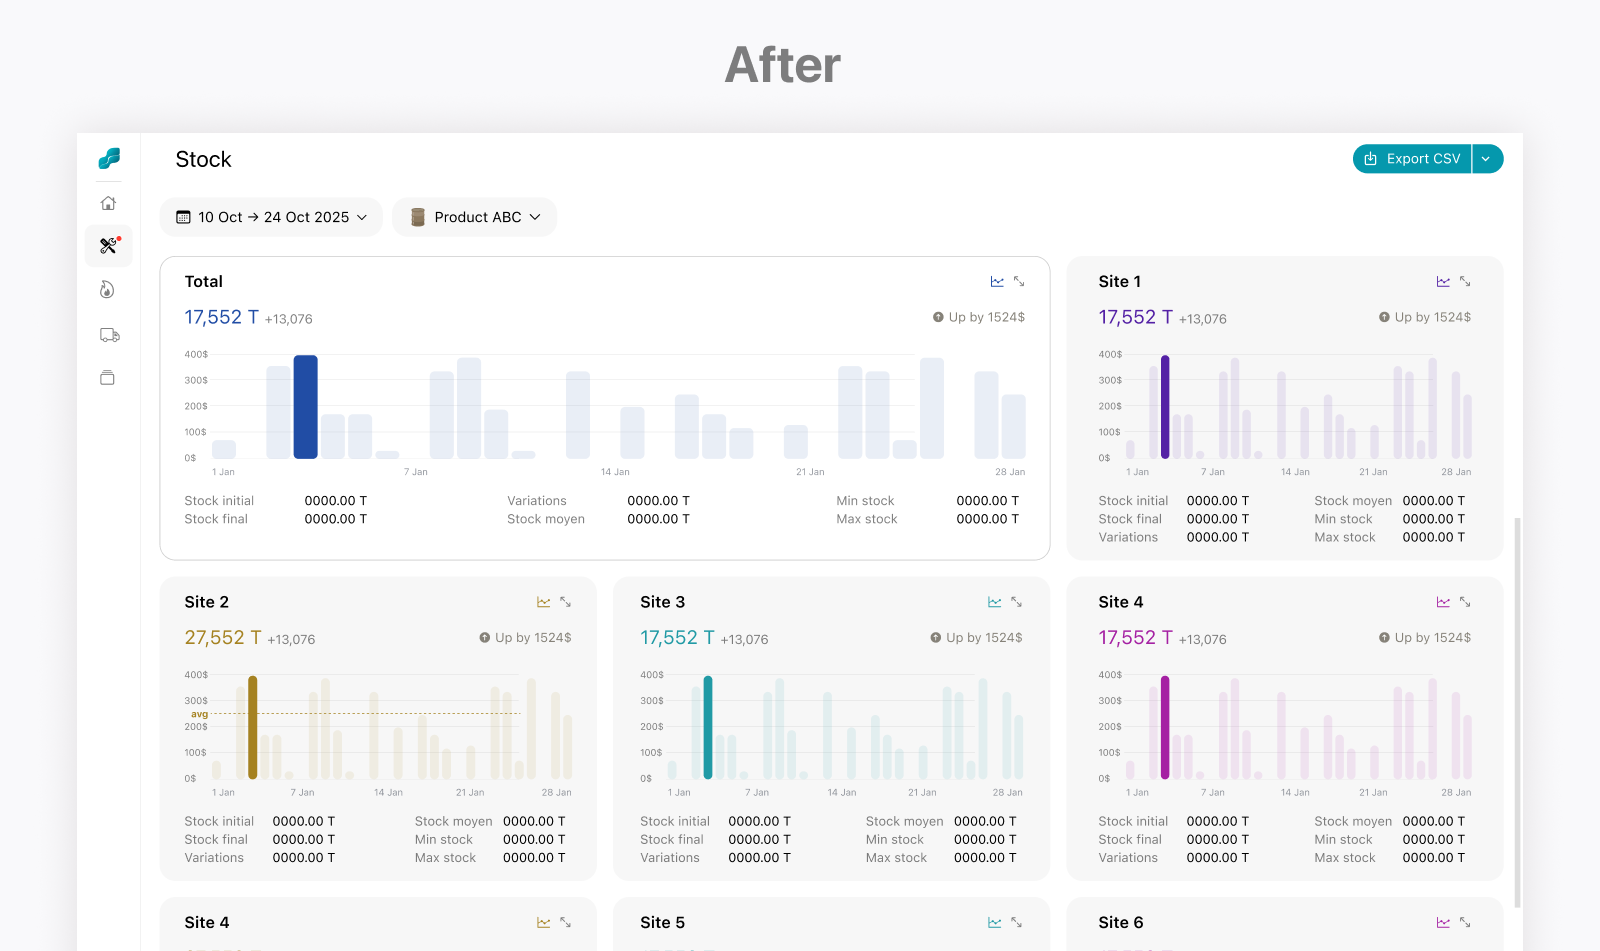
Designing reports for side-by-side site comparison
Designing the reporting experience required me to understand the client’s internal reports without extensive direct input from users during the early stages. I reviewed the existing Excel, PowerPoint, and PDF files, extracted and organized the reports into categories, and identified the underlying purpose of each one. I used this structure to develop initial reporting concepts, which I then presented to users and refined through feedback.
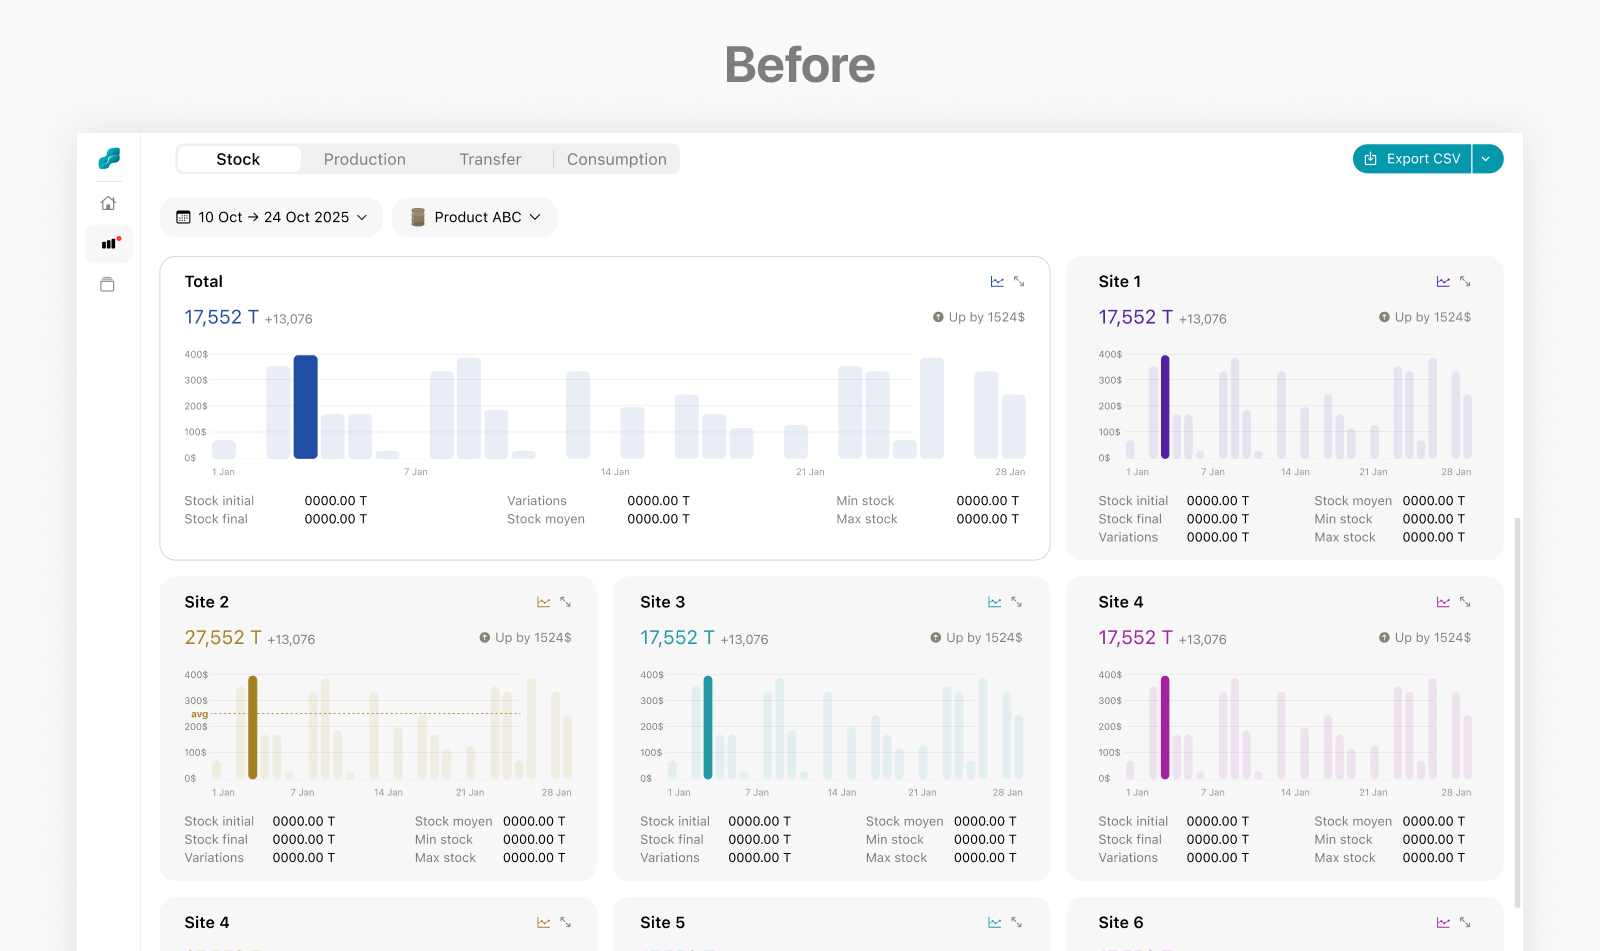
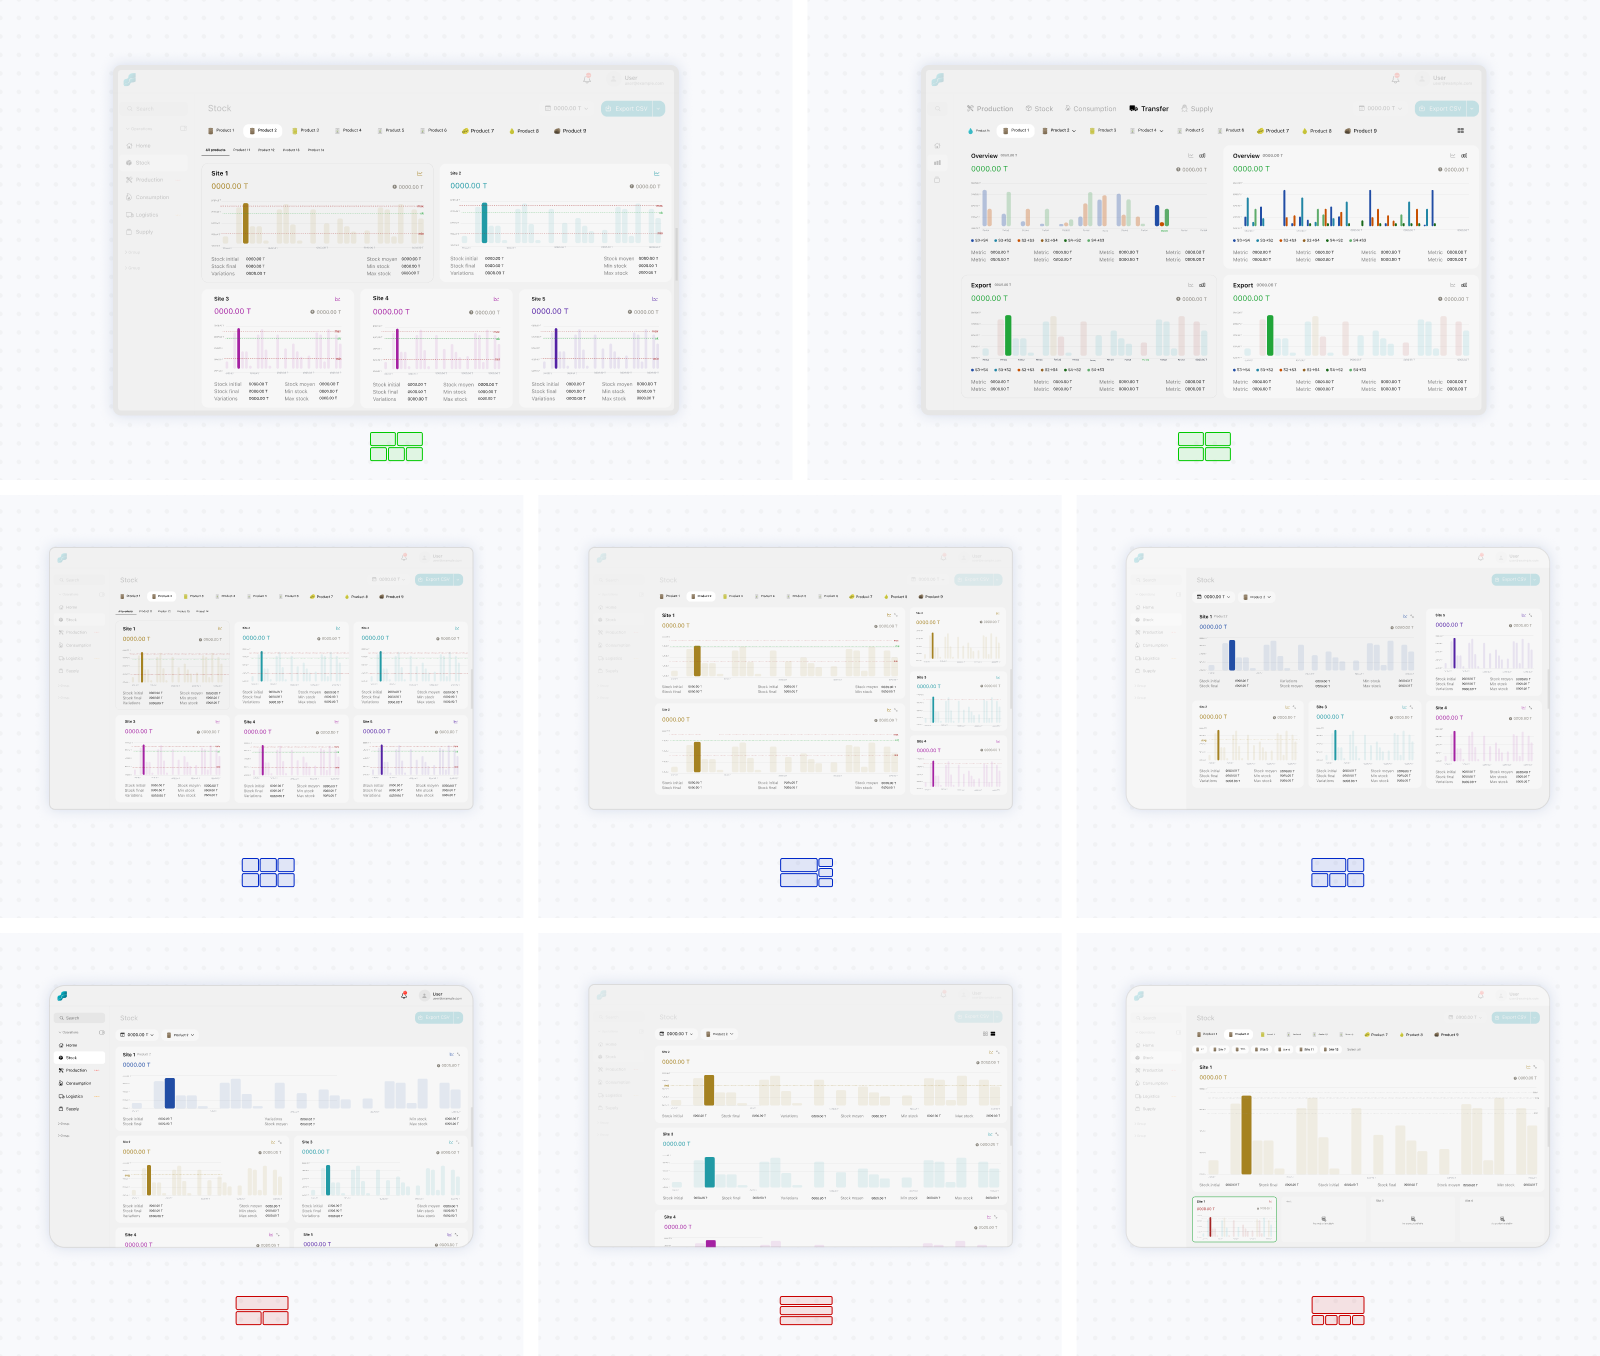
I explored several architectures for moving between reporting contexts. One direction treated sites as the primary tabs, with reports for production, stock, consumption, and transfers organized within each site. Another treated report types as the primary tabs and displayed all relevant sites within the selected report. I also explored variations combining tabs, filters, and separate views. My initial instinct was to prioritize sites and show one at a time because this reduced repetition and simplified each screen. However, managers frequently needed to compare the same operational measure across multiple sites. Although the report-first structure displayed more information and felt visually repetitive, it supported this comparison much more effectively and was strongly preferred during reviews.
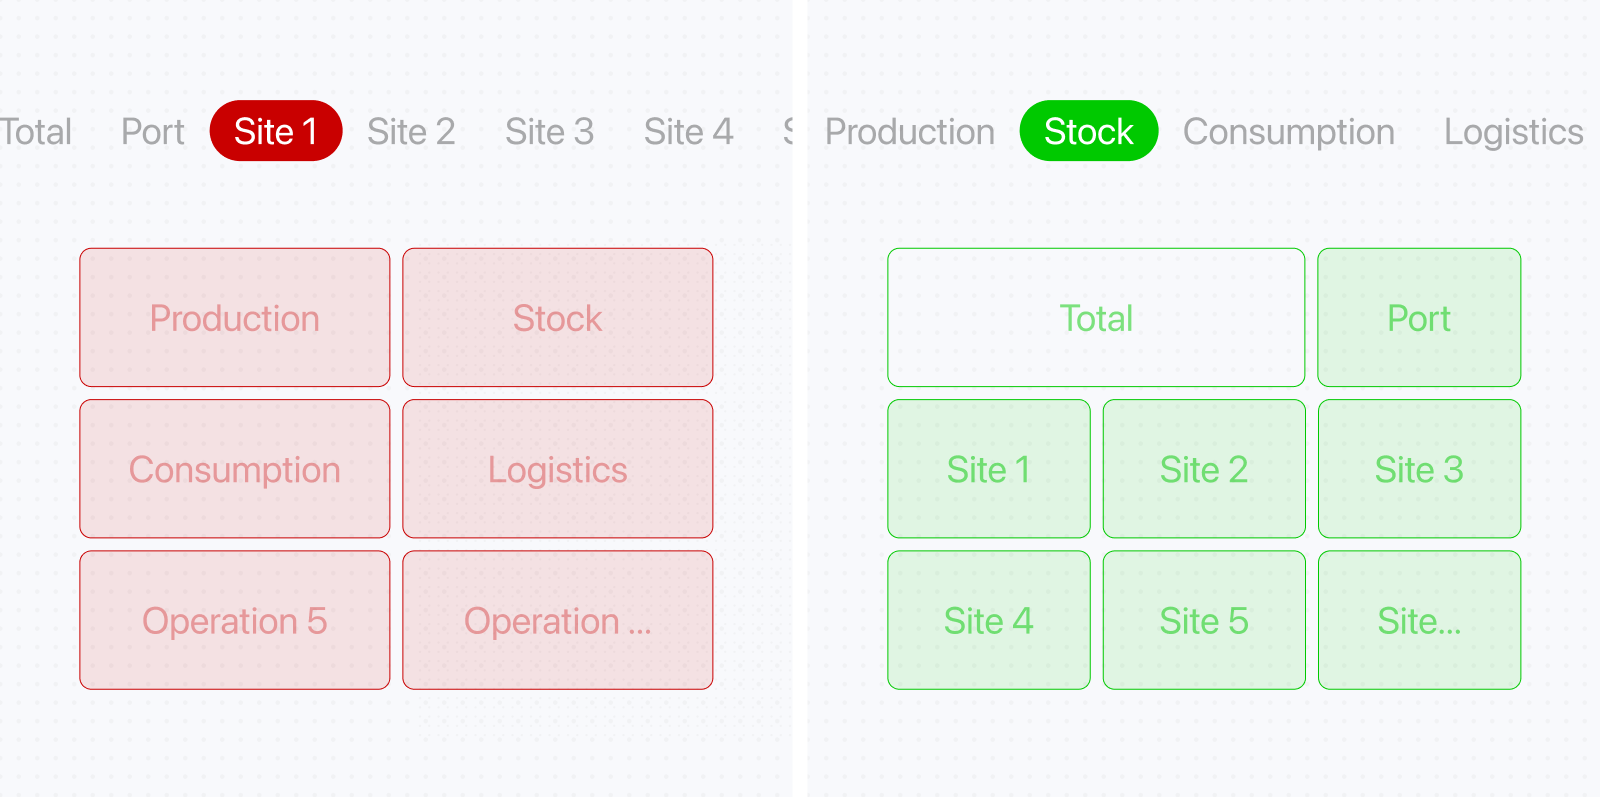
Another decision was whether to hide sites that did not produce the selected material. Instead of removing them dynamically, the final approach preserved their positions and used empty states to indicate that the site did not produce that material. The global overview always remained in the top-left, the primary production site beside it, and the remaining sites below.
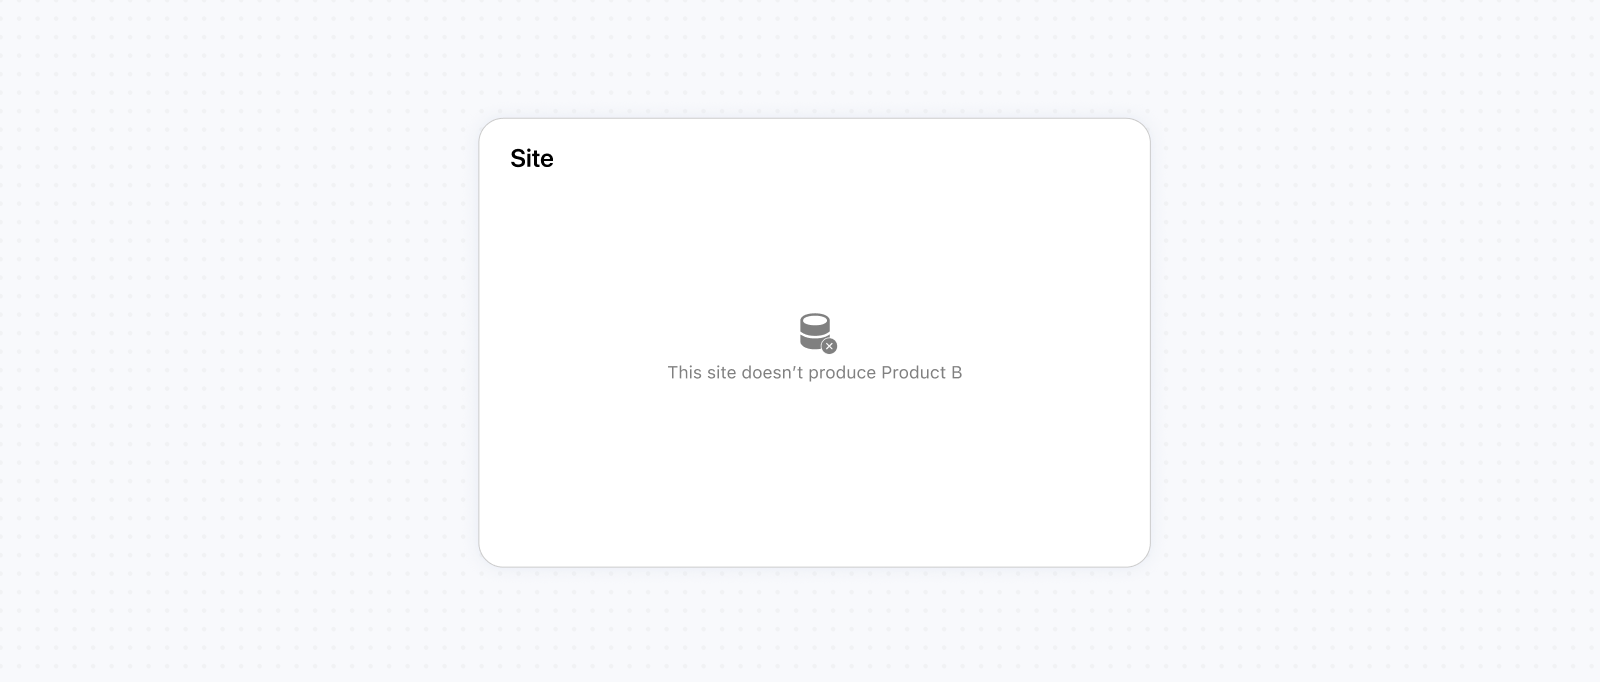
I explored multiple layouts and prioritization systems because production varied across materials, meaning that some site cards would naturally contain no data. The final structure introduced the fewest compromises overall. It maintained spatial consistency for most materials while creating imperfect cases for only a smaller subset. Combined with material filters, this allowed users to explore historical production, stock, consumption, and transfer trends across multiple sites within the same reporting experience.
Preserving familiarity while improving data visualization
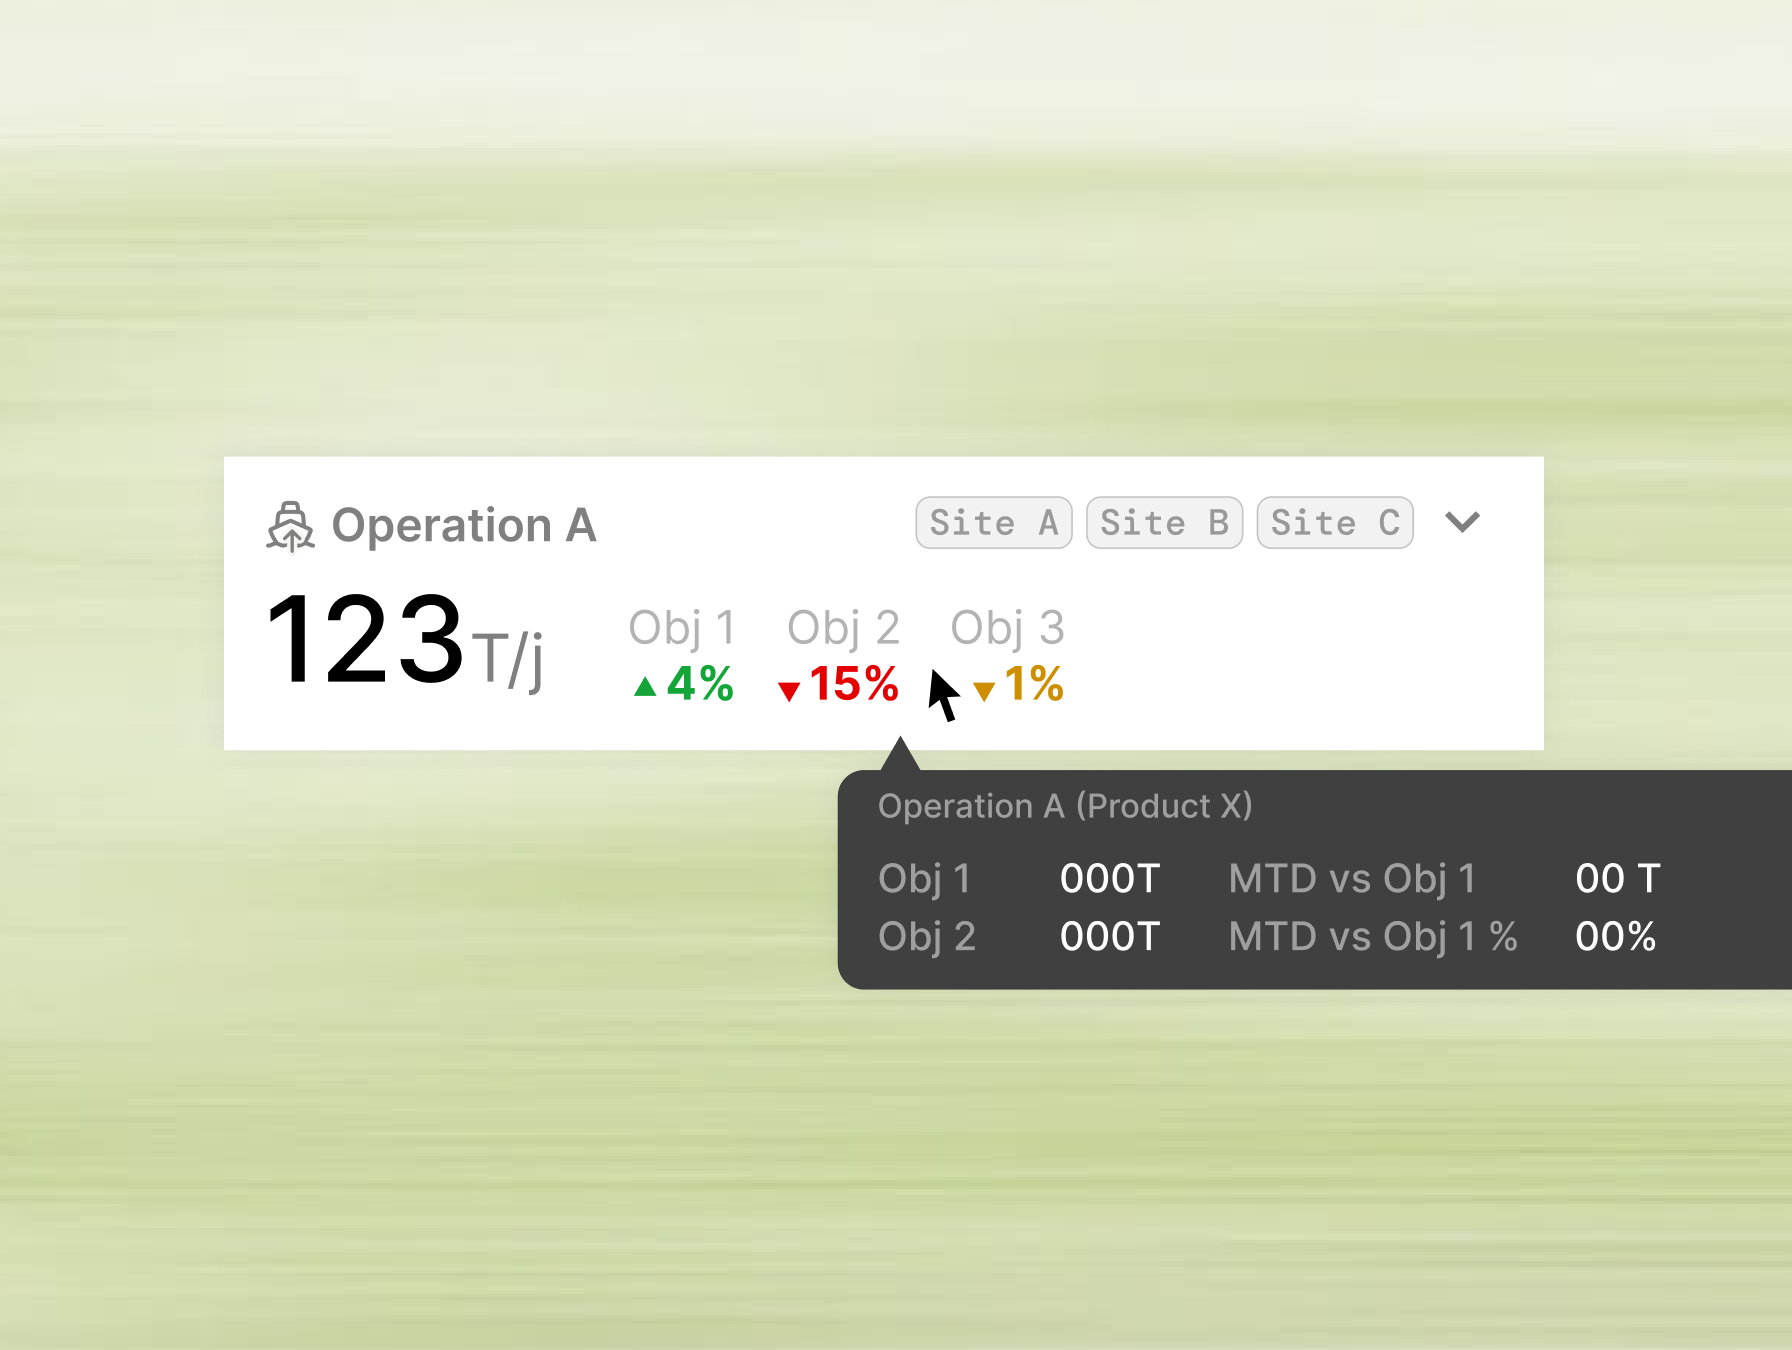
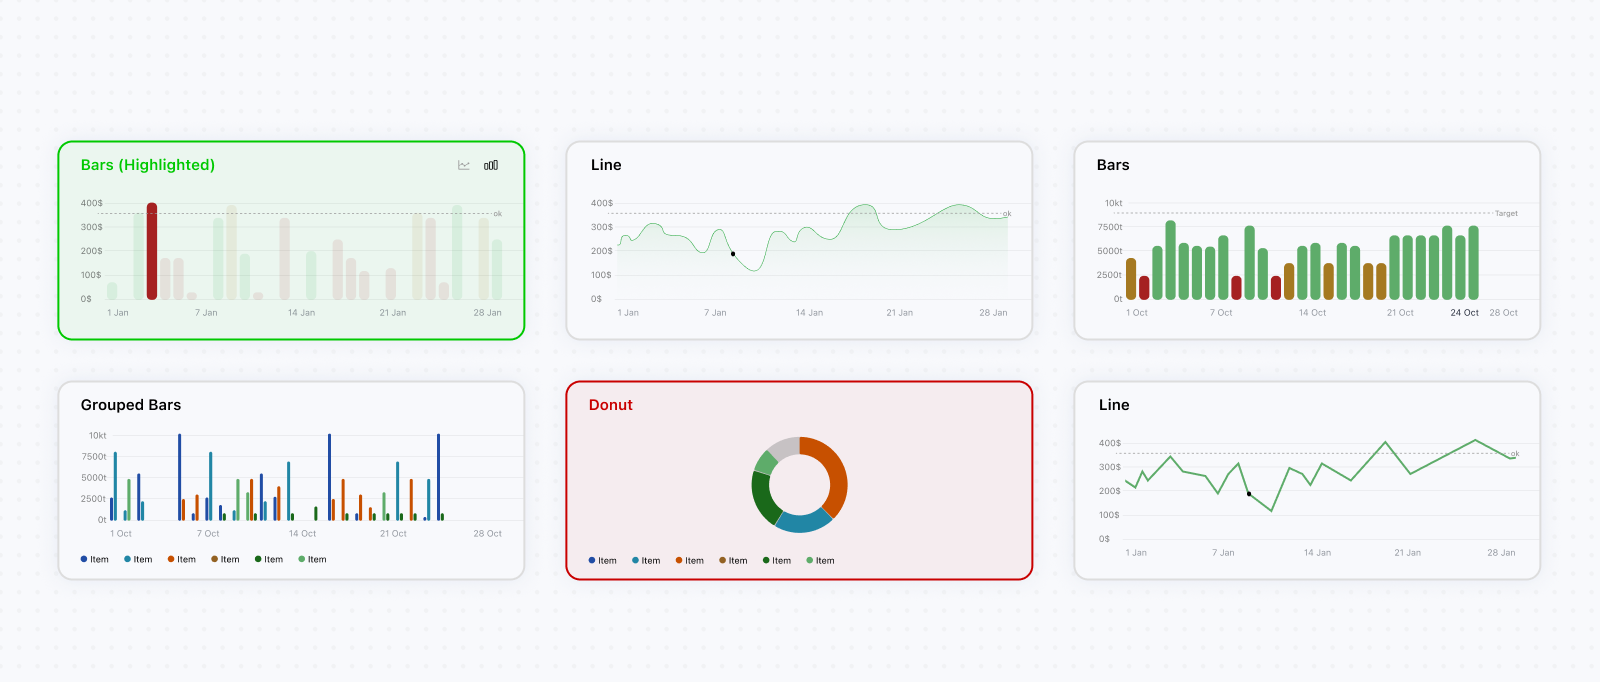
The client’s existing reporting systems used both line and bar charts across departments without a consistent rule for when each should be used. Rather than forcing every report into a single visualization type, I supported both across the historical charts to avoid unnecessary change-management friction. Line charts were used when identifying longer-term trends was the priority, while bar charts supported clearer day-to-day comparisons depending on the analytical context. Chart values followed the client’s existing color logic, while interactive details made discrepancies easier to identify and investigate. I also introduced several KPIs that were not explicitly included in the existing reports but logically supported the questions users were trying to answer. During reviews, I learned that managers had already been manually inferring some of these values, which suggested that surfacing them directly could be useful.
Inter-site transfers required a different compromise. These were relatively exceptional cases in which one site supplied intermediary materials to another site experiencing excess demand or shortages. The existing reports represented transfers through grouped bar charts. Although I initially wanted to explore alternative visualizations, the limited timeline and stakeholders’ familiarity with this approach made preserving it the more pragmatic decision. Color coding became more difficult in these charts because grouped series required several distinct colors that conflicted with the material-based color system used elsewhere in the platform. After exploring alternatives such as patterns, we removed material color coding from the transfer charts to preserve clarity and reduce visual noise.
Separating simulation from recommendations
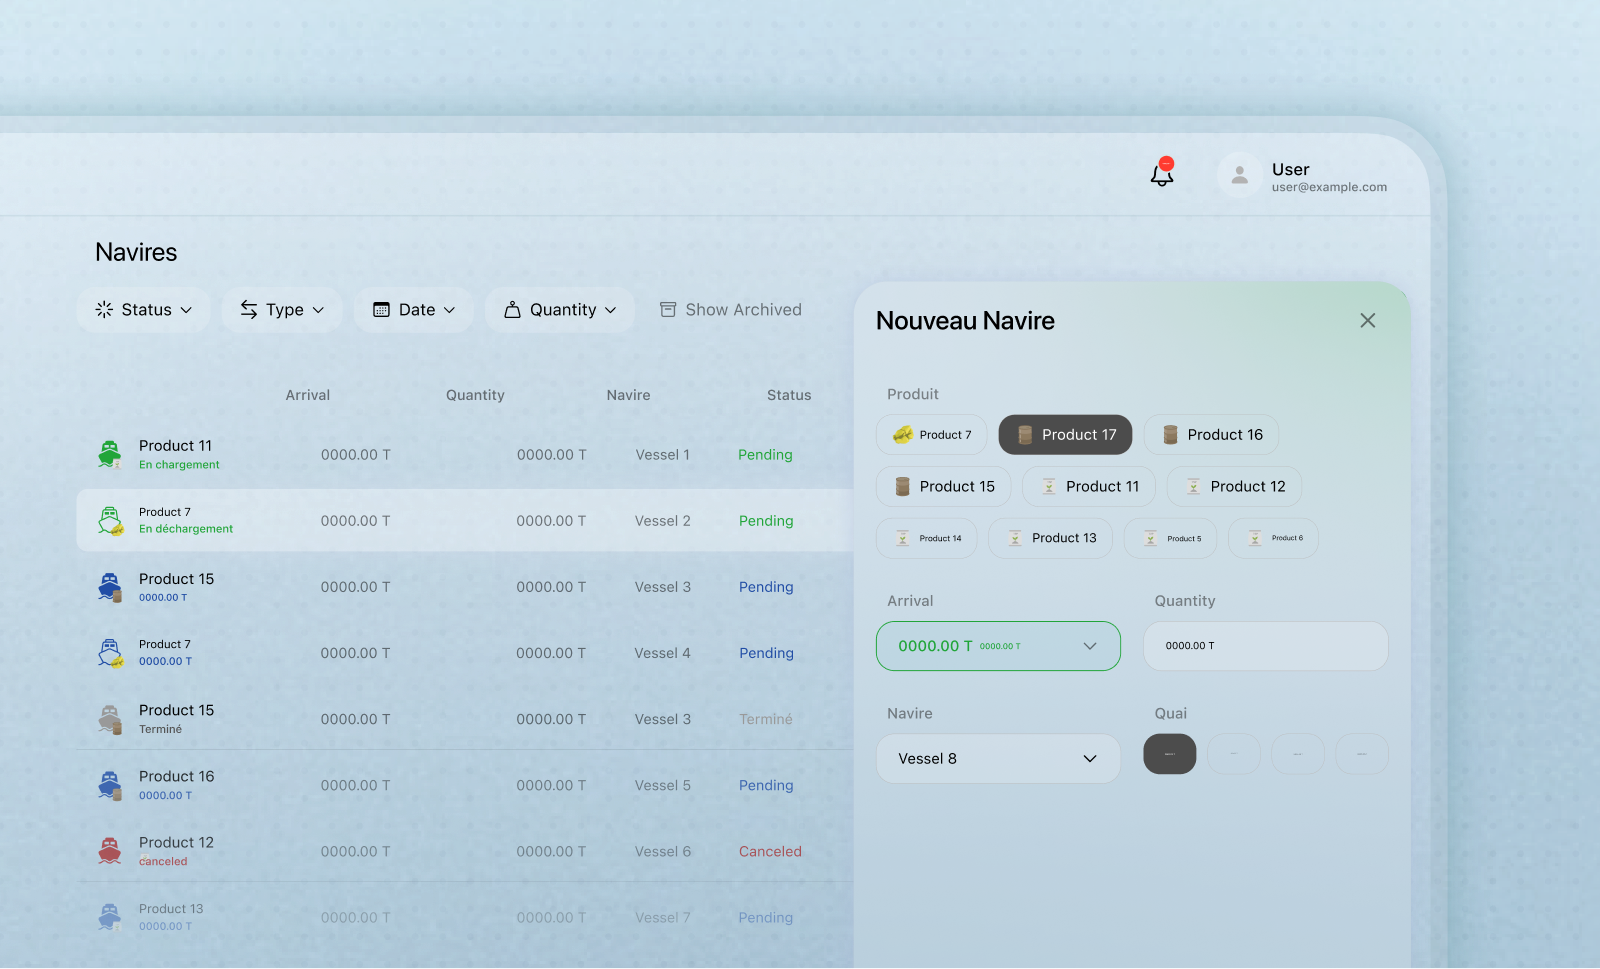
Designing the simulation and recommendation flows was one of the most challenging parts of the project because the feature was still ambiguous for both the product and engineering teams. The broader goal was clear: use AI models to anticipate future operational performance and suggest possible actions. However, most early discussions focused on implementation complexity rather than how users would move through the experience. A major decision was separating the experience into two distinct flows. Simulations allowed users to configure operational assumptions and constraints, create scenarios, and review their projected performance. Recommendations started from the issues identified within those scenarios and focused on the actions users could take in response. This separation clarified the purpose of each flow and prevented scenario inputs, model outputs, and suggested actions from being forced into a single interface. As these workflows became clearer, the feature grew into a smaller product within the wider platform, with its own creation, editing, review, and management flows across more than ten interconnected screens.
Designing how users configure operational scenarios
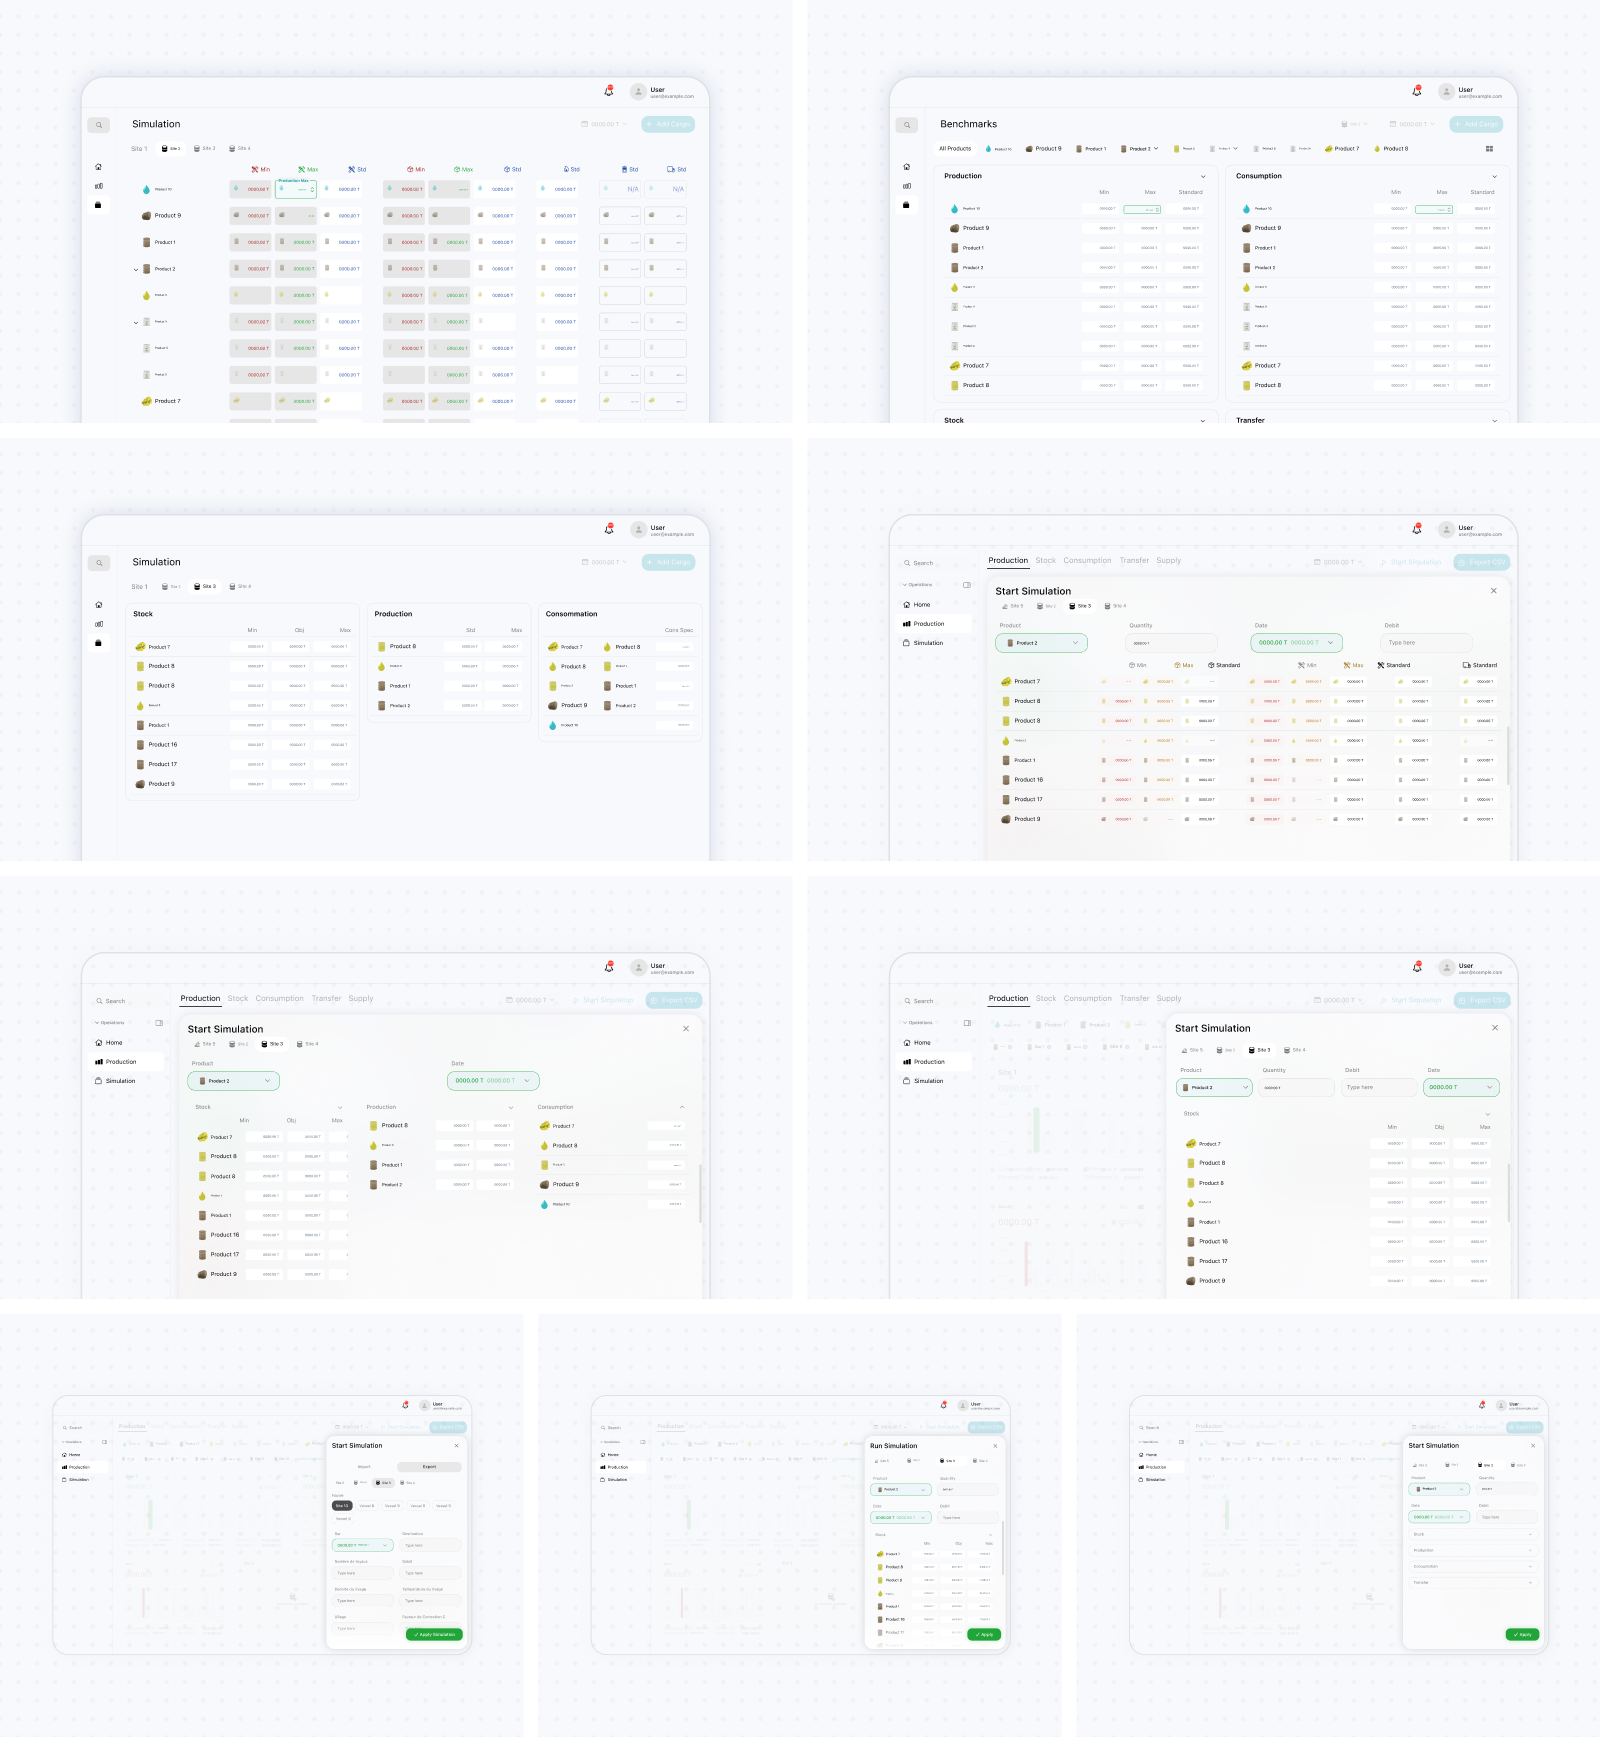
Creating a simulation required users to configure parameters and constraints across several parts of the supply chain, including production, stock, capacities, downtime, transfers, arrivals, and shipment operations. Presenting all of these inputs in a single form would have made scenarios difficult to configure and review. I organized the parameters into operational categories and used tables to give users an overview of the current configuration. Contextual panels allowed them to edit a selected group of parameters without losing sight of the wider scenario. This structure made it possible to manage a large number of related inputs while keeping the main interface relatively stable. Simulations were also treated as saved scenarios rather than temporary requests sent to the model. Users could create, name, review, and return to previous scenarios instead of rebuilding their assumptions each time. Import/export orders and vessels were handled through a dedicated supporting flow because they had their own products, quantities, arrival dates, and operational statuses.
Turning AI outputs into actionable recommendations
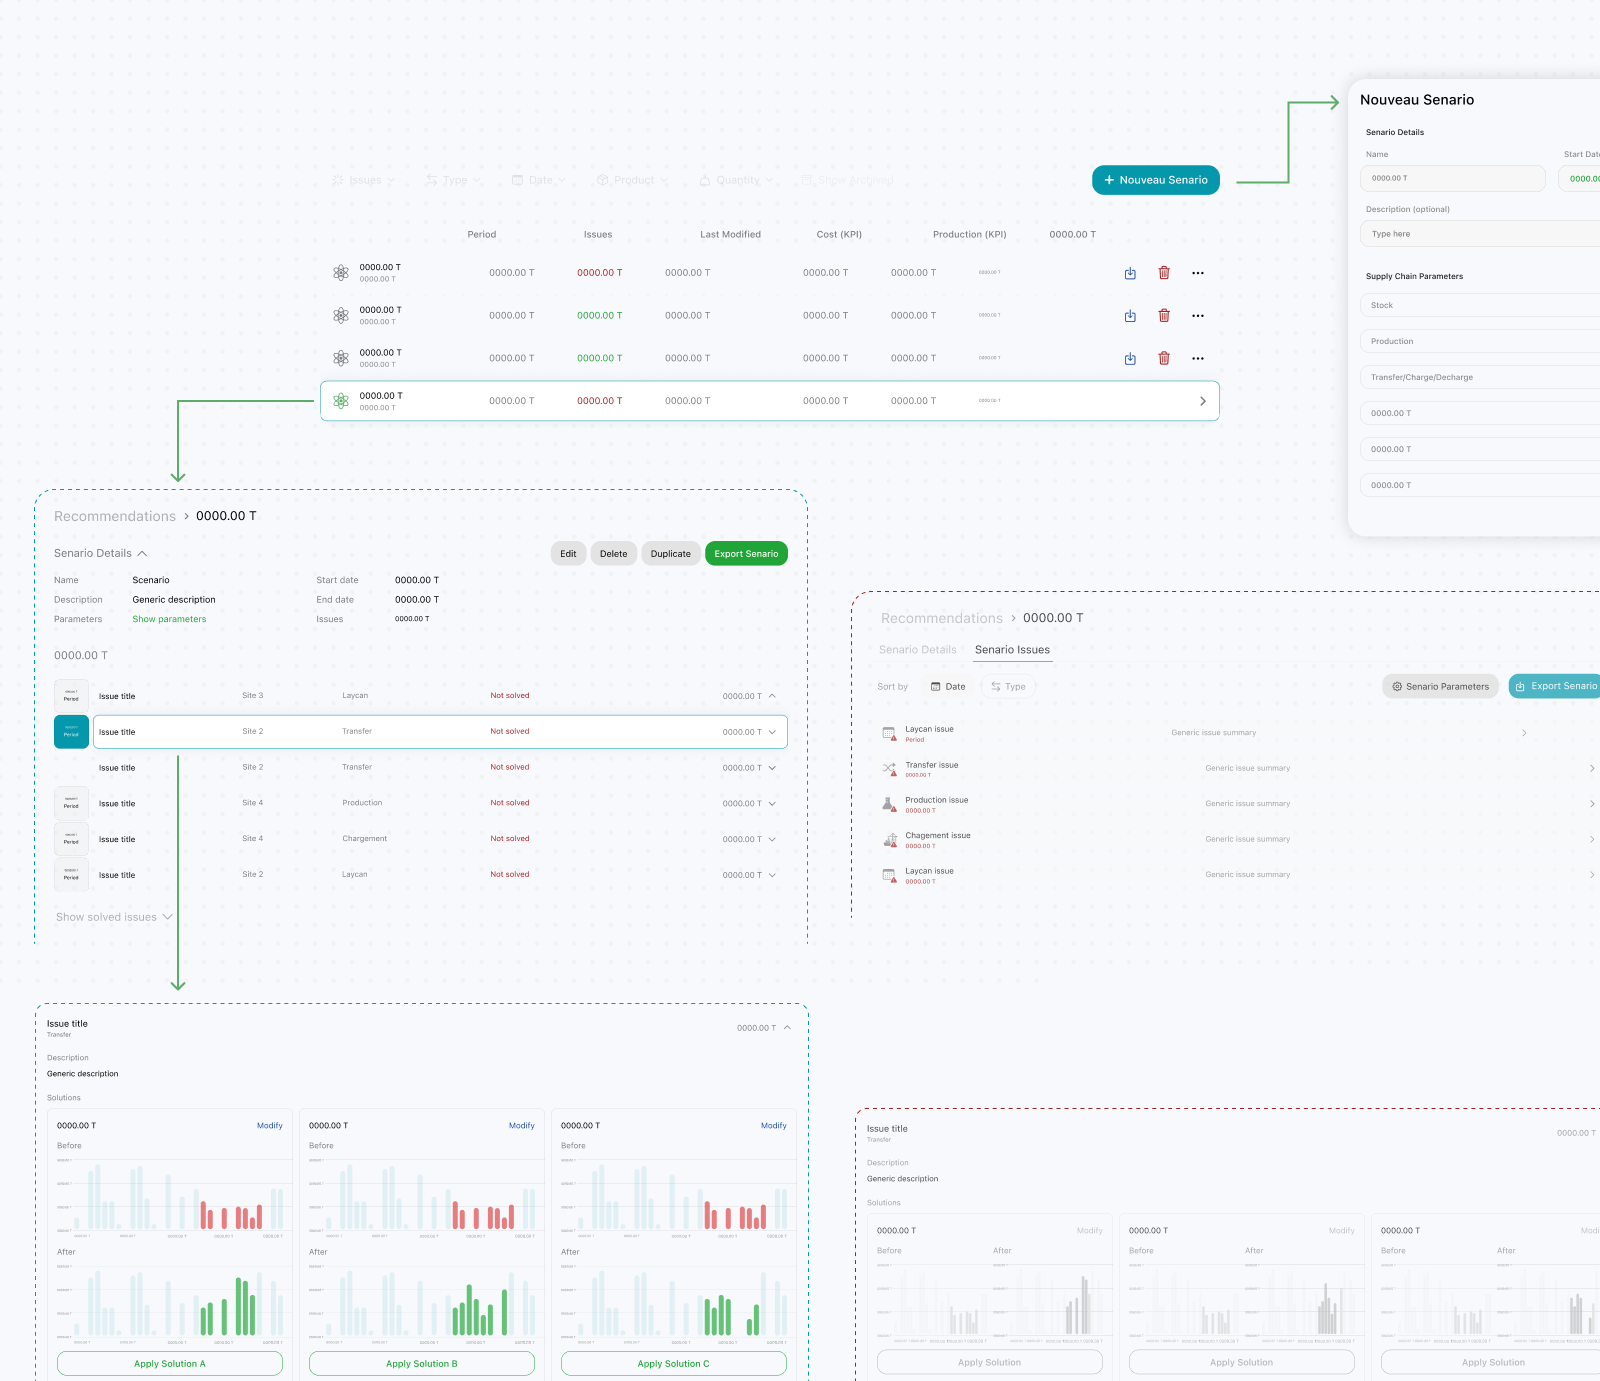
Recommendations needed to provide more than a general list of suggestions. I structured the experience around the operational issues identified within each scenario. Each issue was connected to its relevant context, such as the date, site, material, and operation, allowing users to understand where it occurred before reviewing possible responses. Users could move from a scenario summary into an individual issue and review several recommended solutions. Each solution presented the proposed operational change alongside a visualization of its projected effect. Showing the before-and-after performance helped users compare alternatives and assess the likely impact of a recommendation before deciding whether to apply or modify it. This structure turned the AI output into a decision-making workflow. Instead of presenting recommendations as isolated model results, the interface connected each one to a specific problem, its operational context, and its projected consequences.
