
Designing an AI-Based Platform for Geological Analysis and Mineral Exploration
A look at the UX process and key decisions and tradeoffs behind bringing user-centered design into an AI-based geological platform already in development. The case study explores learning a complex domain, translating expert workflows into product structure, advocating for change within technical constraints, and balancing ambitious interaction models with shippable solutions.
Note: To protect the confidentiality of the company and client, names, real data, and some interface content have been anonymized, changed, or recreated. I have also left out parts of the UX, workflows, and product logic that could reveal how the platform creates value or give competitors useful insight into how it works. This case study therefore presents only selected design decisions and lessons, not a complete account of the product.
Project Context & Constraints
This project was already in active development when I joined as the senior UI/UX designer. The platform had established technical and AI capabilities, along with its primary workflows and technical foundations. I initially focused on improving interface clarity within the existing structure. As research and feedback clarified the operational workflow, my scope expanded to information architecture and core interactions. I worked with geologists, leadership, data scientists, and engineers to prioritize changes that better supported geological tasks within the existing technical foundation.
Another important advantage was that a key product stakeholder was also one of the platform’s primary end users and cared deeply about how it supported the operational workflow, not only its technical capabilities. Research was integrated into recurring interviews, product discussions, and workflow reviews with this stakeholder, allowing me to identify pain points, correct assumptions, and evaluate design decisions against real operational needs throughout development. I also spoke with another geologist familiar with similar systems, adding a second domain perspective to the process. Further sessions with a broader group of geologists were planned for future phases, but the current timeline required us to prioritize the expert access available during development. At the same time, tight deadlines and the existing technical architecture constrained how much could realistically change. Major structural proposals therefore needed careful justification and prioritization. This required me to determine which UX problems were critical enough to challenge, which improvements could fit within the existing foundation, and where compromise was necessary. In many cases, the challenge became finding ways to significantly improve usability, clarity, and workflow alignment while still working within the platform’s technical boundaries.
Business Context & Problem
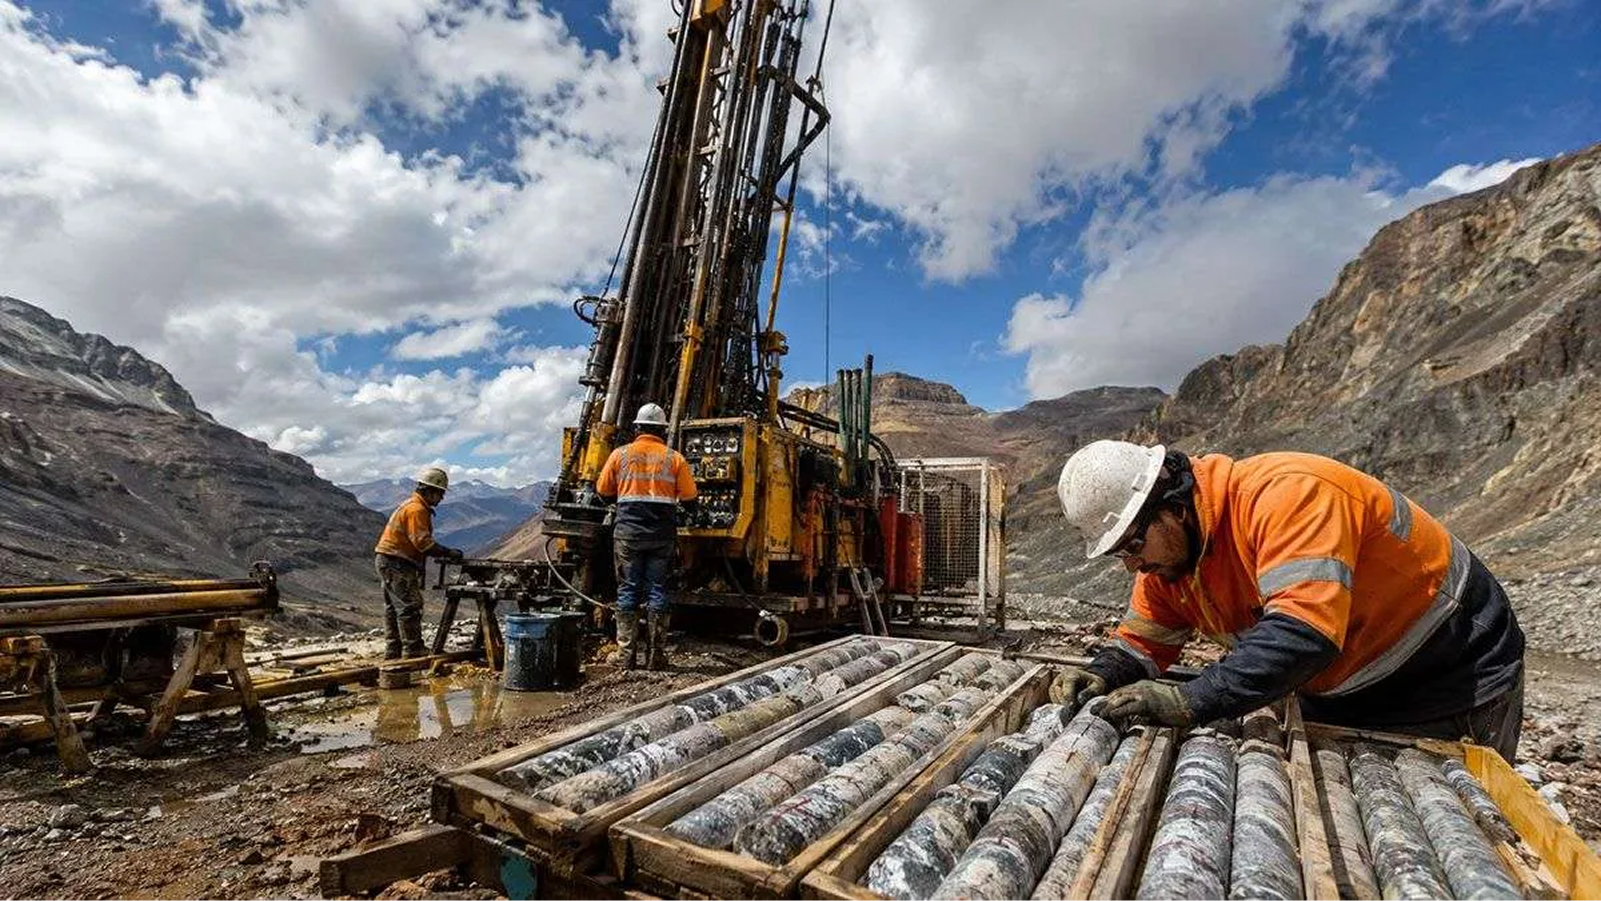
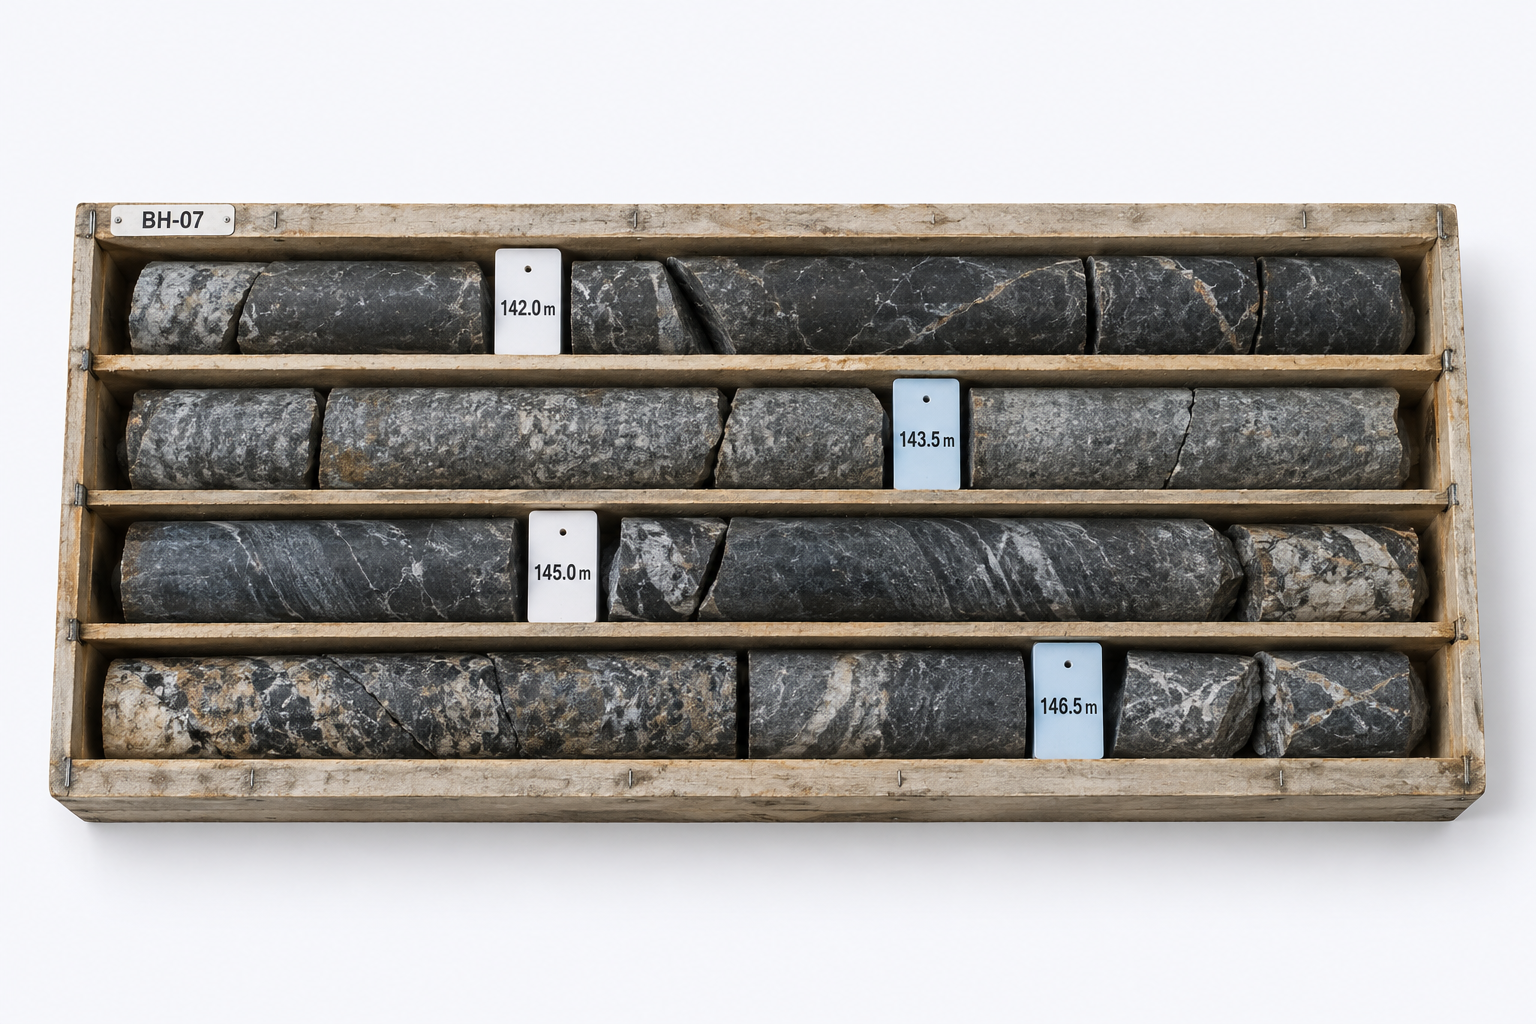
Exploration teams use geological evidence and drill-core samples to investigate subsurface formations and assess mineral potential. They drill boreholes and extract cylindrical core samples that provide a physical record of the subsurface across depth intervals. These samples are organized into sequential boxes, labelled by project, drillhole, and depth interval. Geologists then inspect and document large volumes of core samples segment by segment to identify which areas warrant further investigation. This manual process requires considerable time and specialist attention.
Specialized imaging and sensing systems digitize core samples and capture detailed geological data. Turning these scans into interpretable results still requires preparation, analysis, and review. The project aimed to give users more direct access to this analysis within the platform. The challenge also extended beyond the analysis itself. Teams needed to manage multiple projects, drillholes, and core boxes, access the relevant project data, and maintain the connection between physical samples, depth intervals, captured data, analysis results, and reports. The opportunity was to bring this workflow into a single platform where teams could organize their exploration projects, access geological data in context, prepare captured data for analysis, run AI models, review and interpret the results, create visualizations, and produce reports.
Solution & Impact
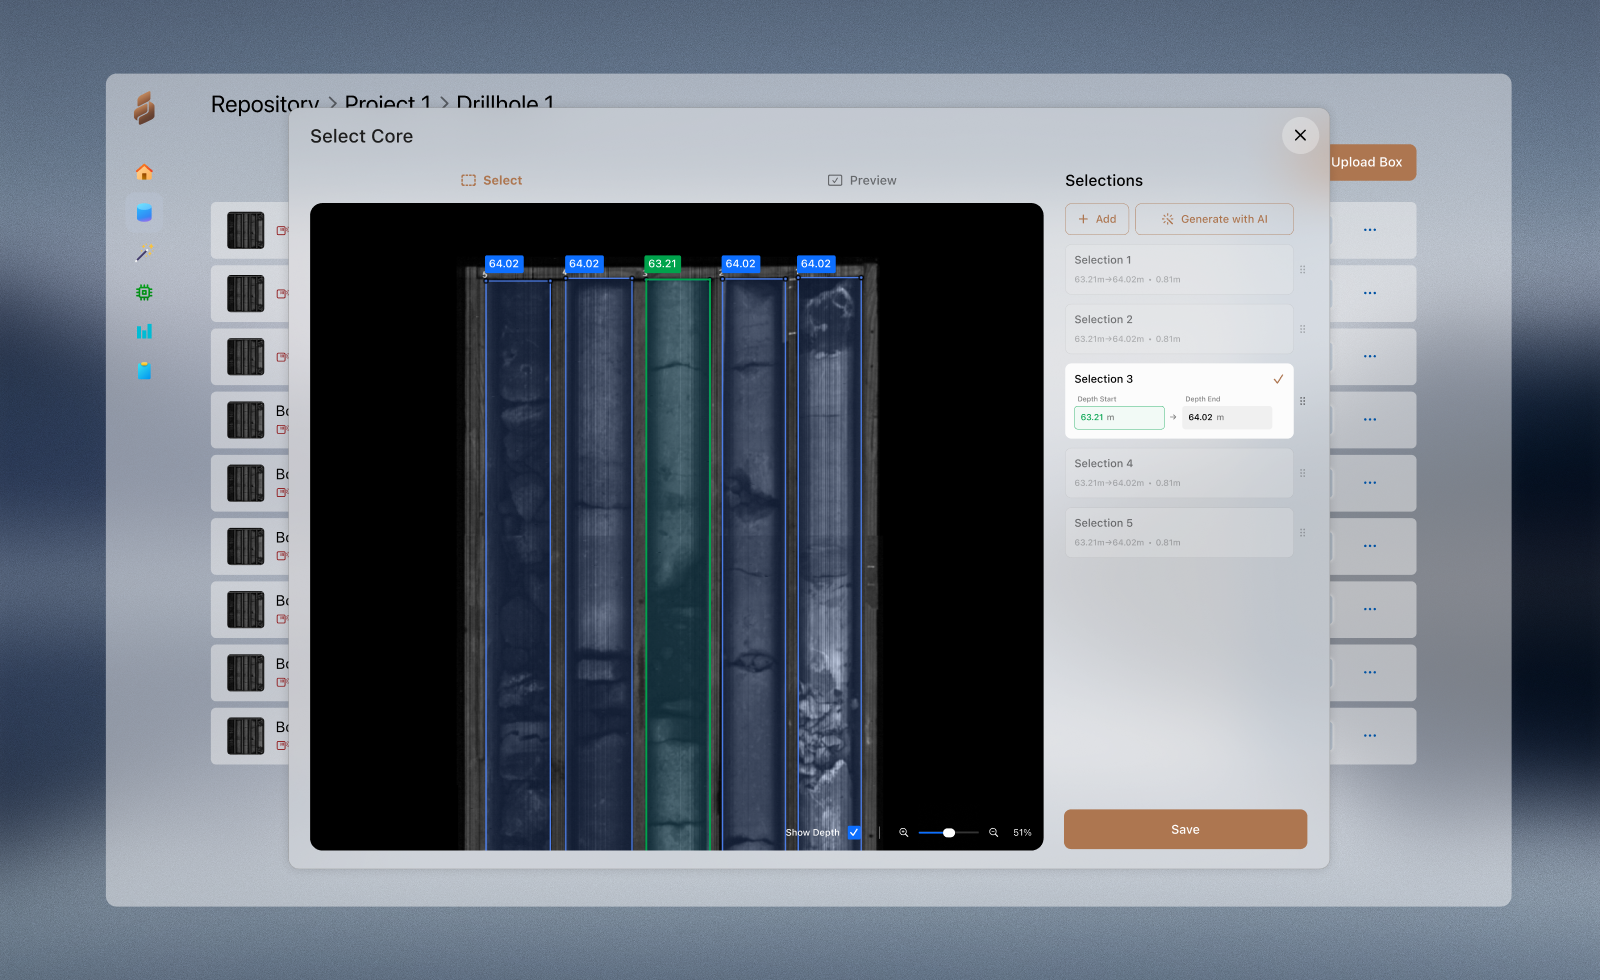
The resulting platform brought project, drillhole, and core box management together with data preparation, AI-based analysis, visualization, interpretation, and reporting. Geological data remained connected to its project and depth context throughout the workflow, while user access provided a foundation for multiple specialists to work with the same centralized information. The platform was evaluated through several rounds of testing and feedback with the geologists and project stakeholders involved. The final round covered the end-to-end workflow using real geological data. Participating geologists provided positive feedback on the workflows tested, while remaining issues were documented for future improvement.
Because the platform had not yet been used long enough to measure its operational impact, no quantitative results were available. Its expected value was a shorter path from captured data to usable results, less manual effort, more efficient access to project information, and reduced dependence on lengthy external analysis cycles. Centralizing projects, samples, results, and reports also created opportunities for better coordination and collaboration between users. Some areas of the experience were identified for further improvement but could not be addressed within the project timeline. These were documented as priorities for a future release.
Domain Understanding & Research Approach
Joining midway through an active, fast-moving project meant I had not been part of the early requirements discussions, and the remaining timeline left little room for a long discovery phase or a series of dedicated research sessions. I therefore adapted the approach by combining rapid domain learning with ongoing product discussions and continuous validation throughout the design process. I first reviewed the available documents and worked closely with the engineers and project managers to understand the product, its technical foundations, and what had already been established about the users' needs. It quickly became clear that understanding the functionality alone was not enough to understand how geologists actually worked, so I built a working knowledge of geological exploration, drilling, core sampling, and project structures before deeper product discussions. I often take this approach in specialized domains because it makes research conversations more productive and allows the limited available time with domain experts to focus on the specific workflow rather than basic concepts. On top of this, when specialists feel that their work is understood, they can speak more openly about frustrations, expectations, and unmet needs instead of spending the conversation explaining the fundamentals of their domain.
My initial goal was to complement this understanding with direct exposure to the operational environment. I wanted to visit exploration sites, observe drilling operations, see the sensing and acquisition equipment, and understand the physical scale and constraints behind the workflow, but since field access was not possible early in the project and only became available near the end of development, I relied on technical videos, documentaries, research papers, project imagery, and walkthroughs of existing geological systems. Meanwhile, the ongoing discussions focused less on collecting feature requests and more on validating mental models, correcting assumptions, and understanding how geologists interpreted underground data. They covered the broader exploration lifecycle as well as the specific operational details such as project hierarchies, core box structures, depth intervals, and how data moved through preparation, analysis, interpretation, and reporting.
The primary user stakeholder was an experienced geologist, which grounded the discussions in real tasks and operational frustrations. Their previous experience with similar platforms also revealed established expectations around terminology, navigation, and workflow structure. I complemented these conversations by interviewing another geologist familiar with similar systems and reviewing competitive geological platforms to understand common patterns across the industry. I also examined the existing product closely to understand the purpose behind each workflow, control, and visualization. Once the operational process became clearer, I could identify where the product structure needed to better support geological navigation, comparison, and interpretation. Because access to users was limited, my approach was not simply to collect requests and place them onto screens, but to deeply internalize the workflow itself and design around the underlying decision-making process behind geological exploration.
Decisions & Tradeoffs
The redesign required decisions at different levels. Many focused on foundational improvements to the information architecture, visual hierarchy, interface consistency, interaction patterns, and system feedback. The more consequential decisions required deeper domain understanding and stronger advocacy because they involved rethinking core workflows. The decisions covered here span segment selection and annotation, processing and interpretation, project exploration, and geological data management. In these areas, the original platform did not fully support the tasks geologists were trying to accomplish, so much of the redesign effort focused on realigning these workflows around efficient interpretation and geological reasoning while respecting the existing technical architecture and project timeline.
Handling missing core in automated segmentation
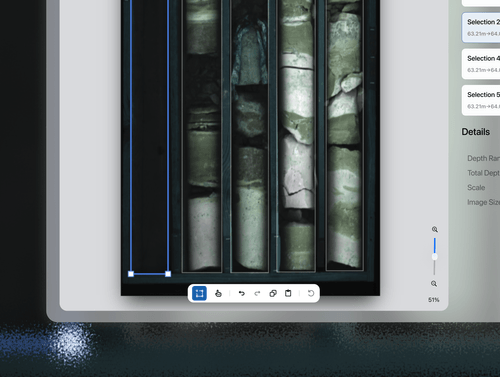
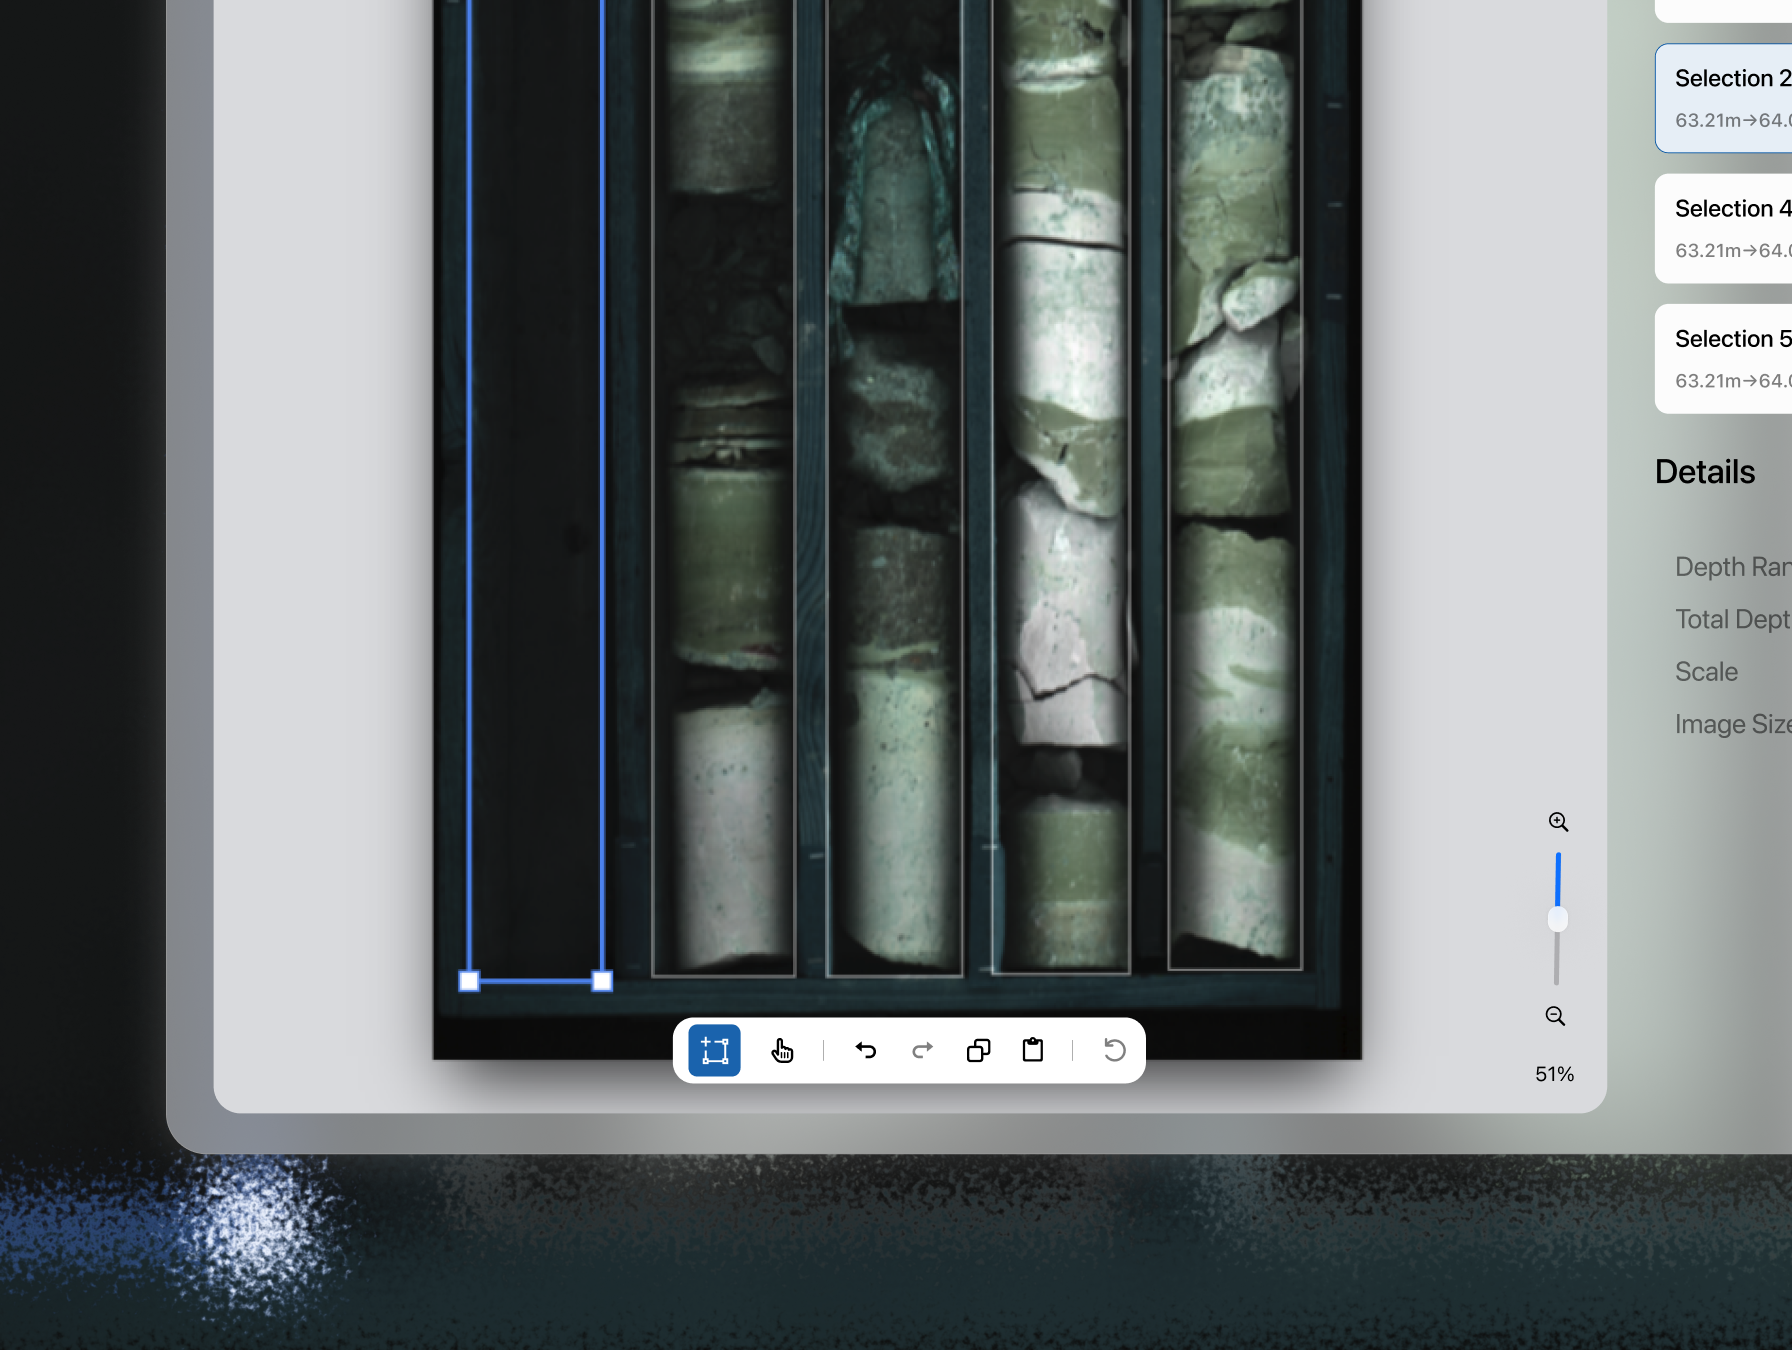
Once drill core box images were uploaded into the platform, the AI models automatically detected and segmented the core intervals inside each box. The geologist’s role was then to validate these selections and manually correct inaccurate, incomplete, or missing detections before any downstream processing could begin. My initial redesign efforts focused mainly on improving the usability of this workflow by restructuring the workspace and replacing the original x and y coordinate system with geological depth values attached directly to each segment. However, this later exposed a critical gap in my understanding of the workflow itself. Like the rest of the team, I initially assumed that the extracted segments would already be complete and correctly aligned. During review sessions, the geologists pointed out that drill core samples frequently contained missing sections and other inconsistencies that required manual correction. Depth intervals were therefore not static metadata generated after segmentation, but part of the interpretation and validation process itself. This became a major structural issue because the original segmentation logic had already been built around fixed, automatically calculated intervals.
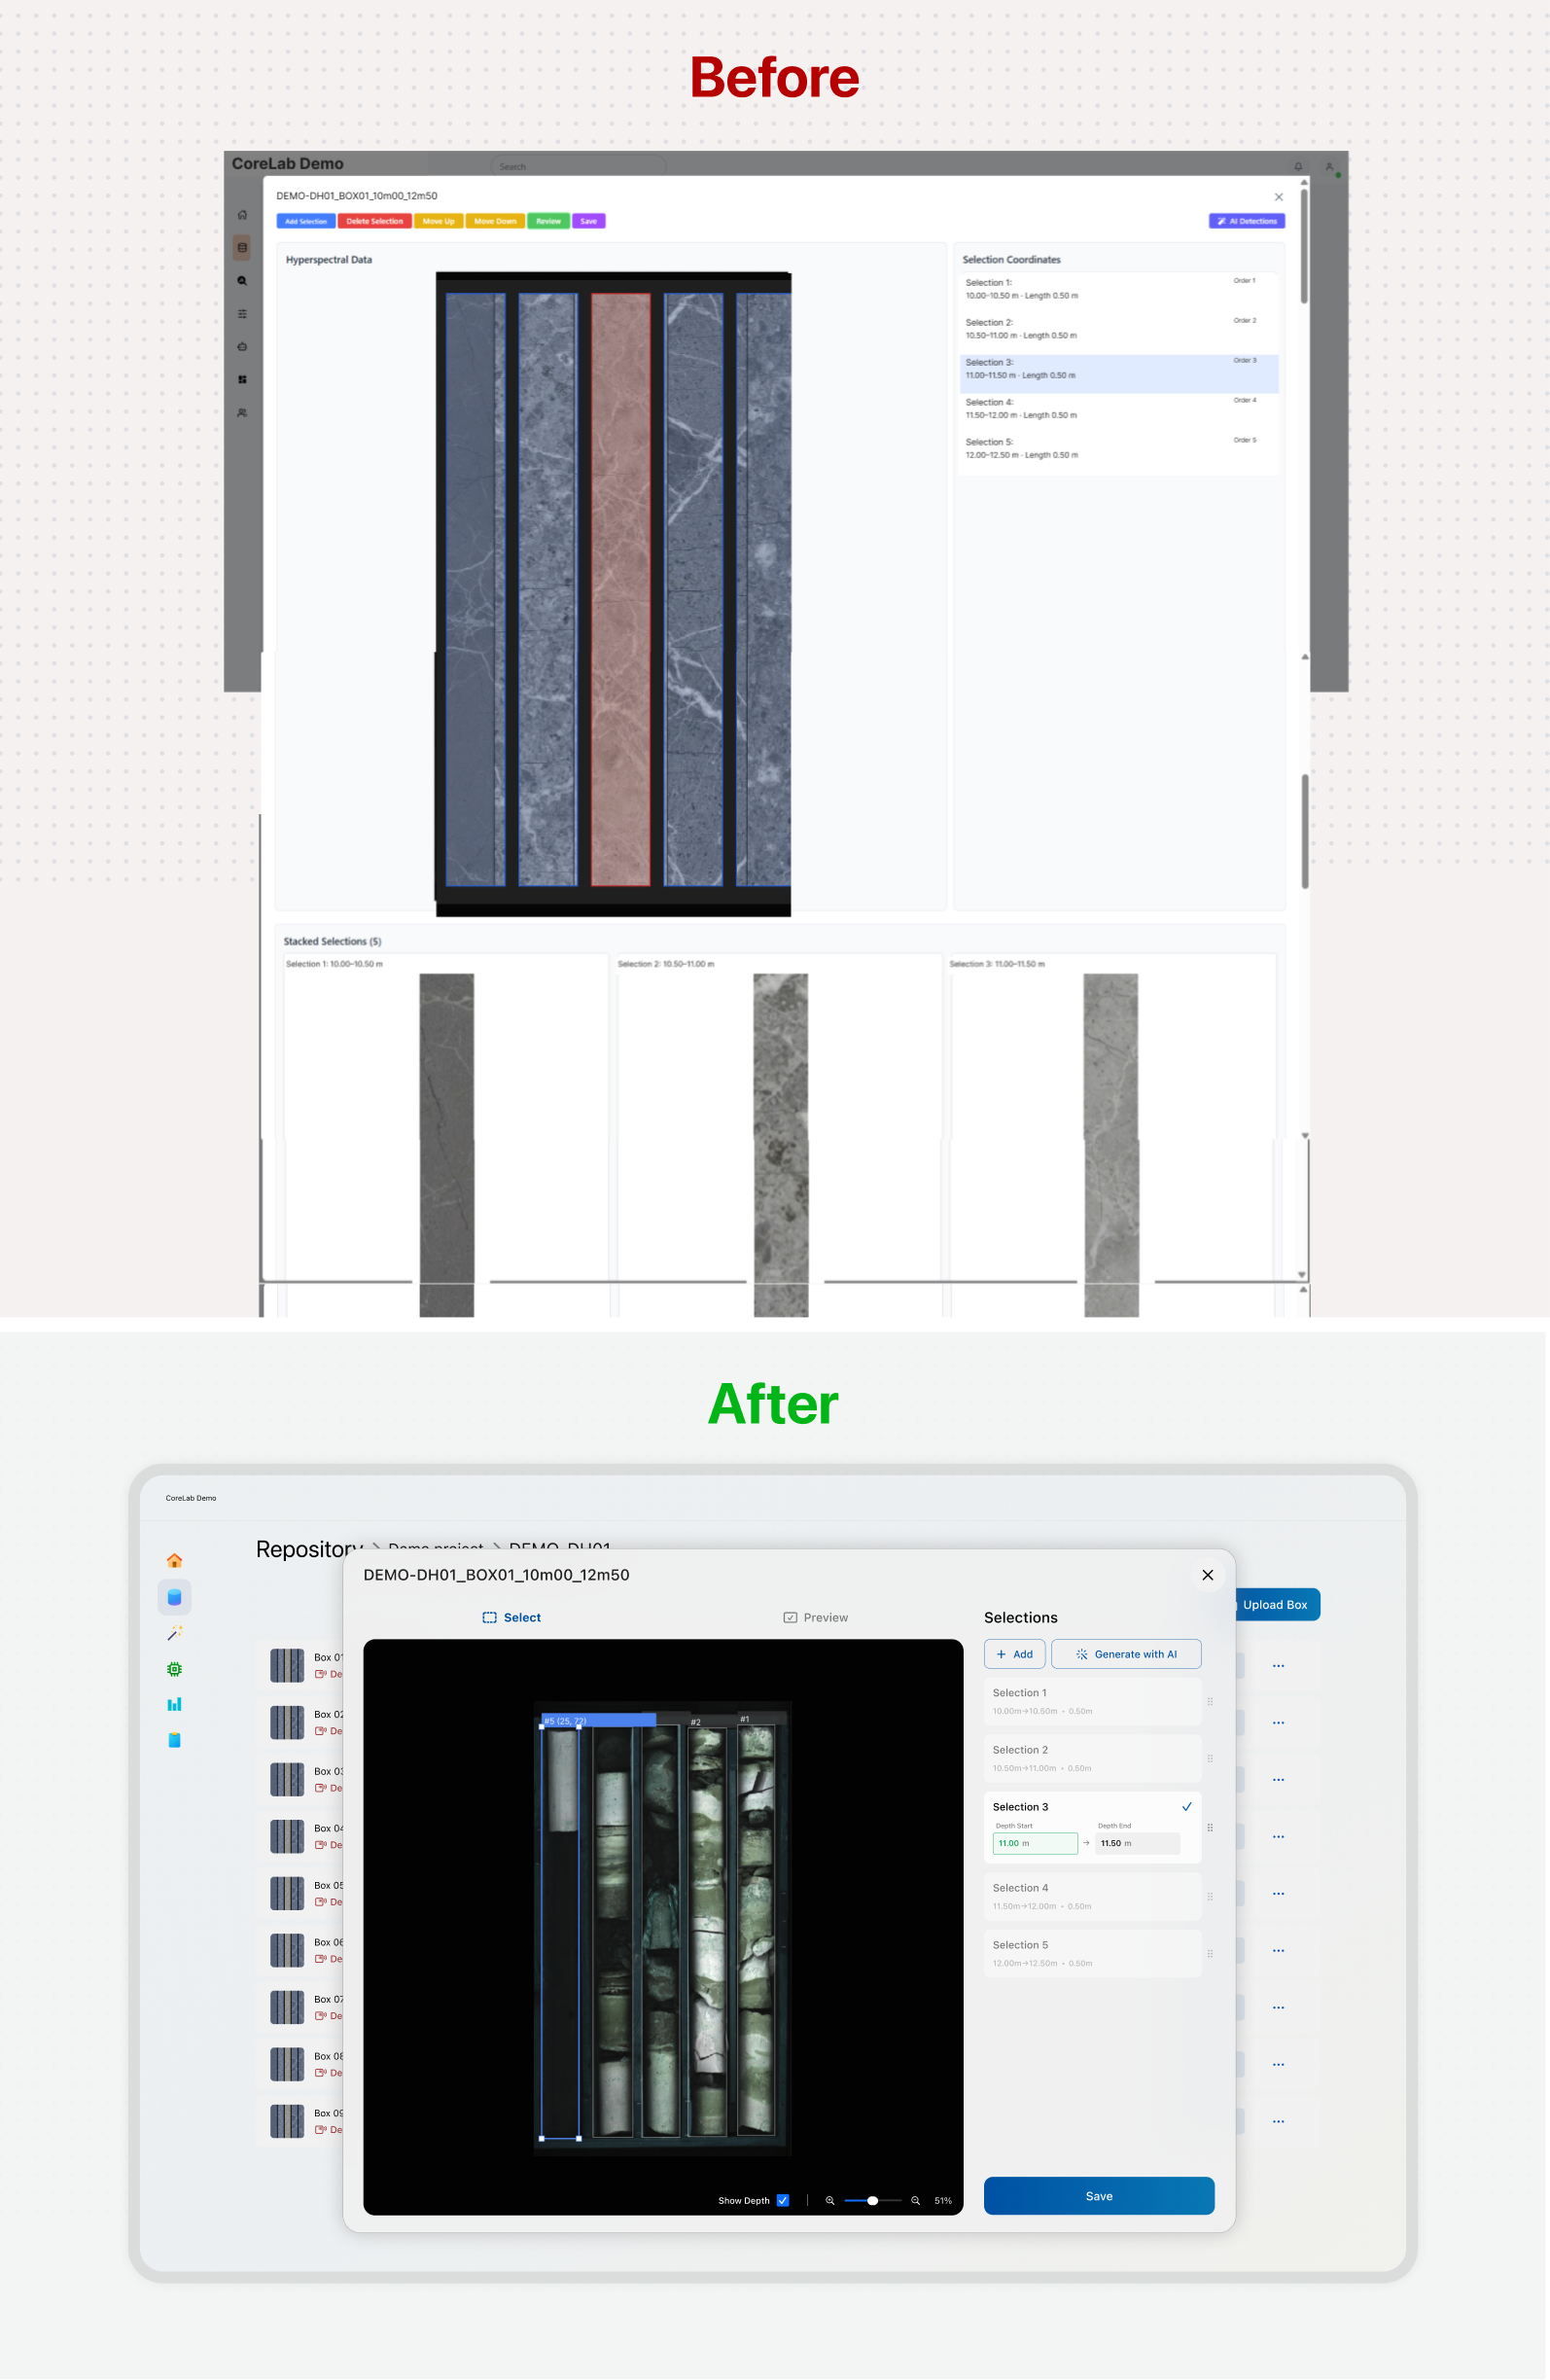
To better match the geological workflow, I proposed a tagging interaction inspired by how geologists physically label core boxes in operational facilities. Users could click anywhere along the core image and place editable depth markers directly inside the workspace. Although this approach strongly resonated with the geologists, it introduced substantial development complexity late in the project timeline. As a compromise, the shipped version represented the intervals as editable entries inside a side panel while connecting them to the corresponding segments and depth boundaries on the image. While less direct, it still gave geologists the ability to validate and correct the data rather than treating the automated segmentation as final. This was also a moment when I underestimated the implementation complexity of an interaction. I had checked its feasibility with one engineer, but the concept was presented before its full scope and dependencies had been reviewed by everyone involved in the implementation.
Reorganizing the core annotation canvas
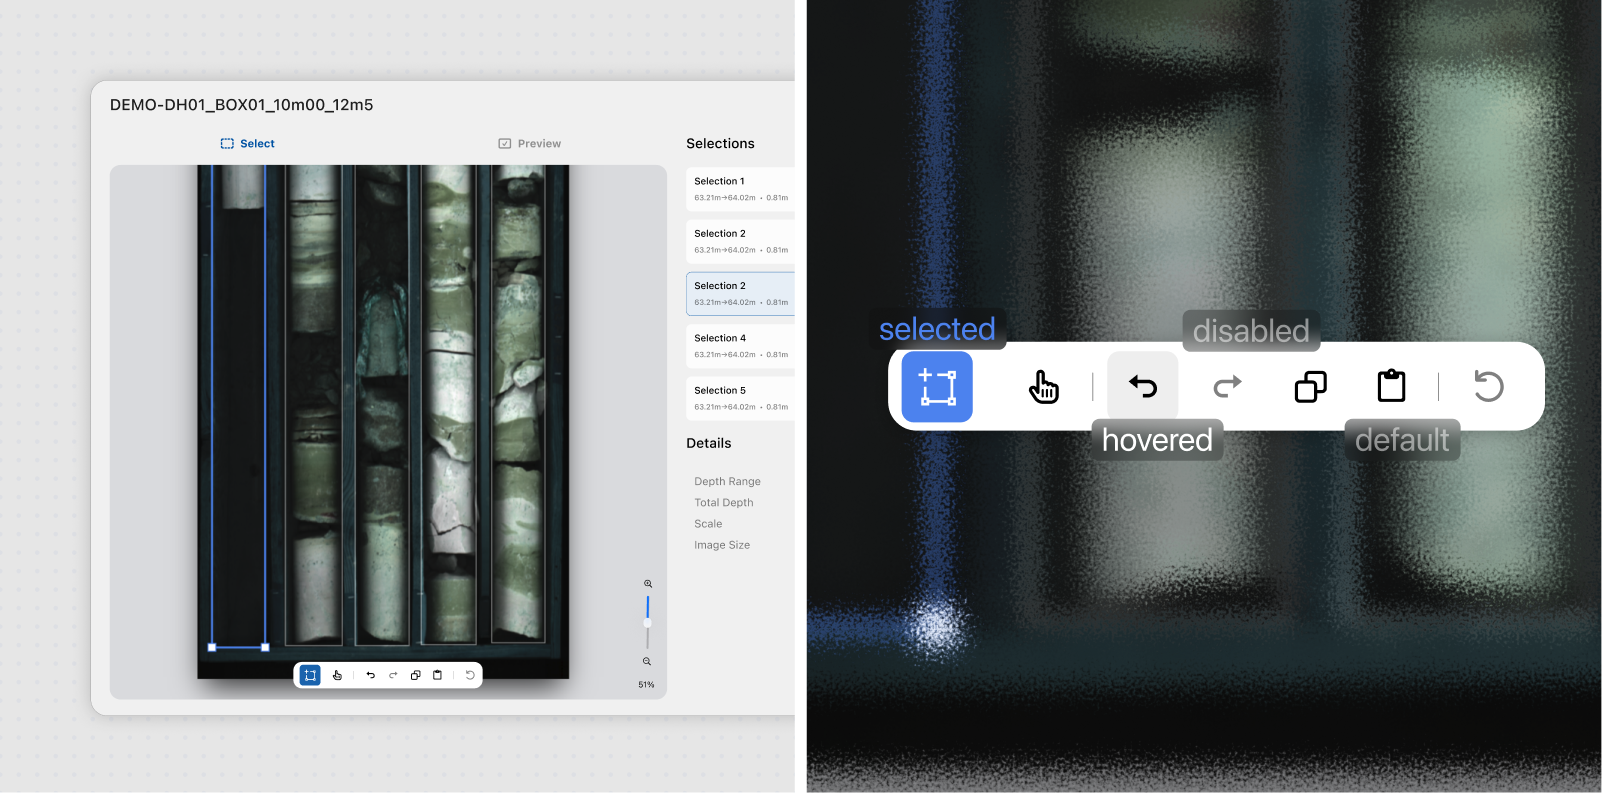
Although the workflow already revolved around a canvas-like interaction model, the experience itself felt fragmented. Controls were scattered across the interface, important actions lacked clear hierarchy, the workspace occupied a relatively small portion of the screen, and selected segment previews were rendered directly below the canvas, creating excessive scrolling and interrupting the user’s flow. Rather than redesigning the interaction from scratch, I focused on reorganizing the experience into a more coherent and dedicated workspace optimized for repetitive geological annotation tasks. Many of the interaction patterns were inspired by tools such as Figma and computer vision annotation software, particularly around direct manipulation, spatial feedback, and persistent workspace behavior. I introduced clearer interaction states, stronger visual distinctions between selected and unselected segments, inline editing controls, segment reordering, annotation tools, and depth interval labels directly inside the workspace. Interactive rulers and depth guides also adapted dynamically to different zoom levels.
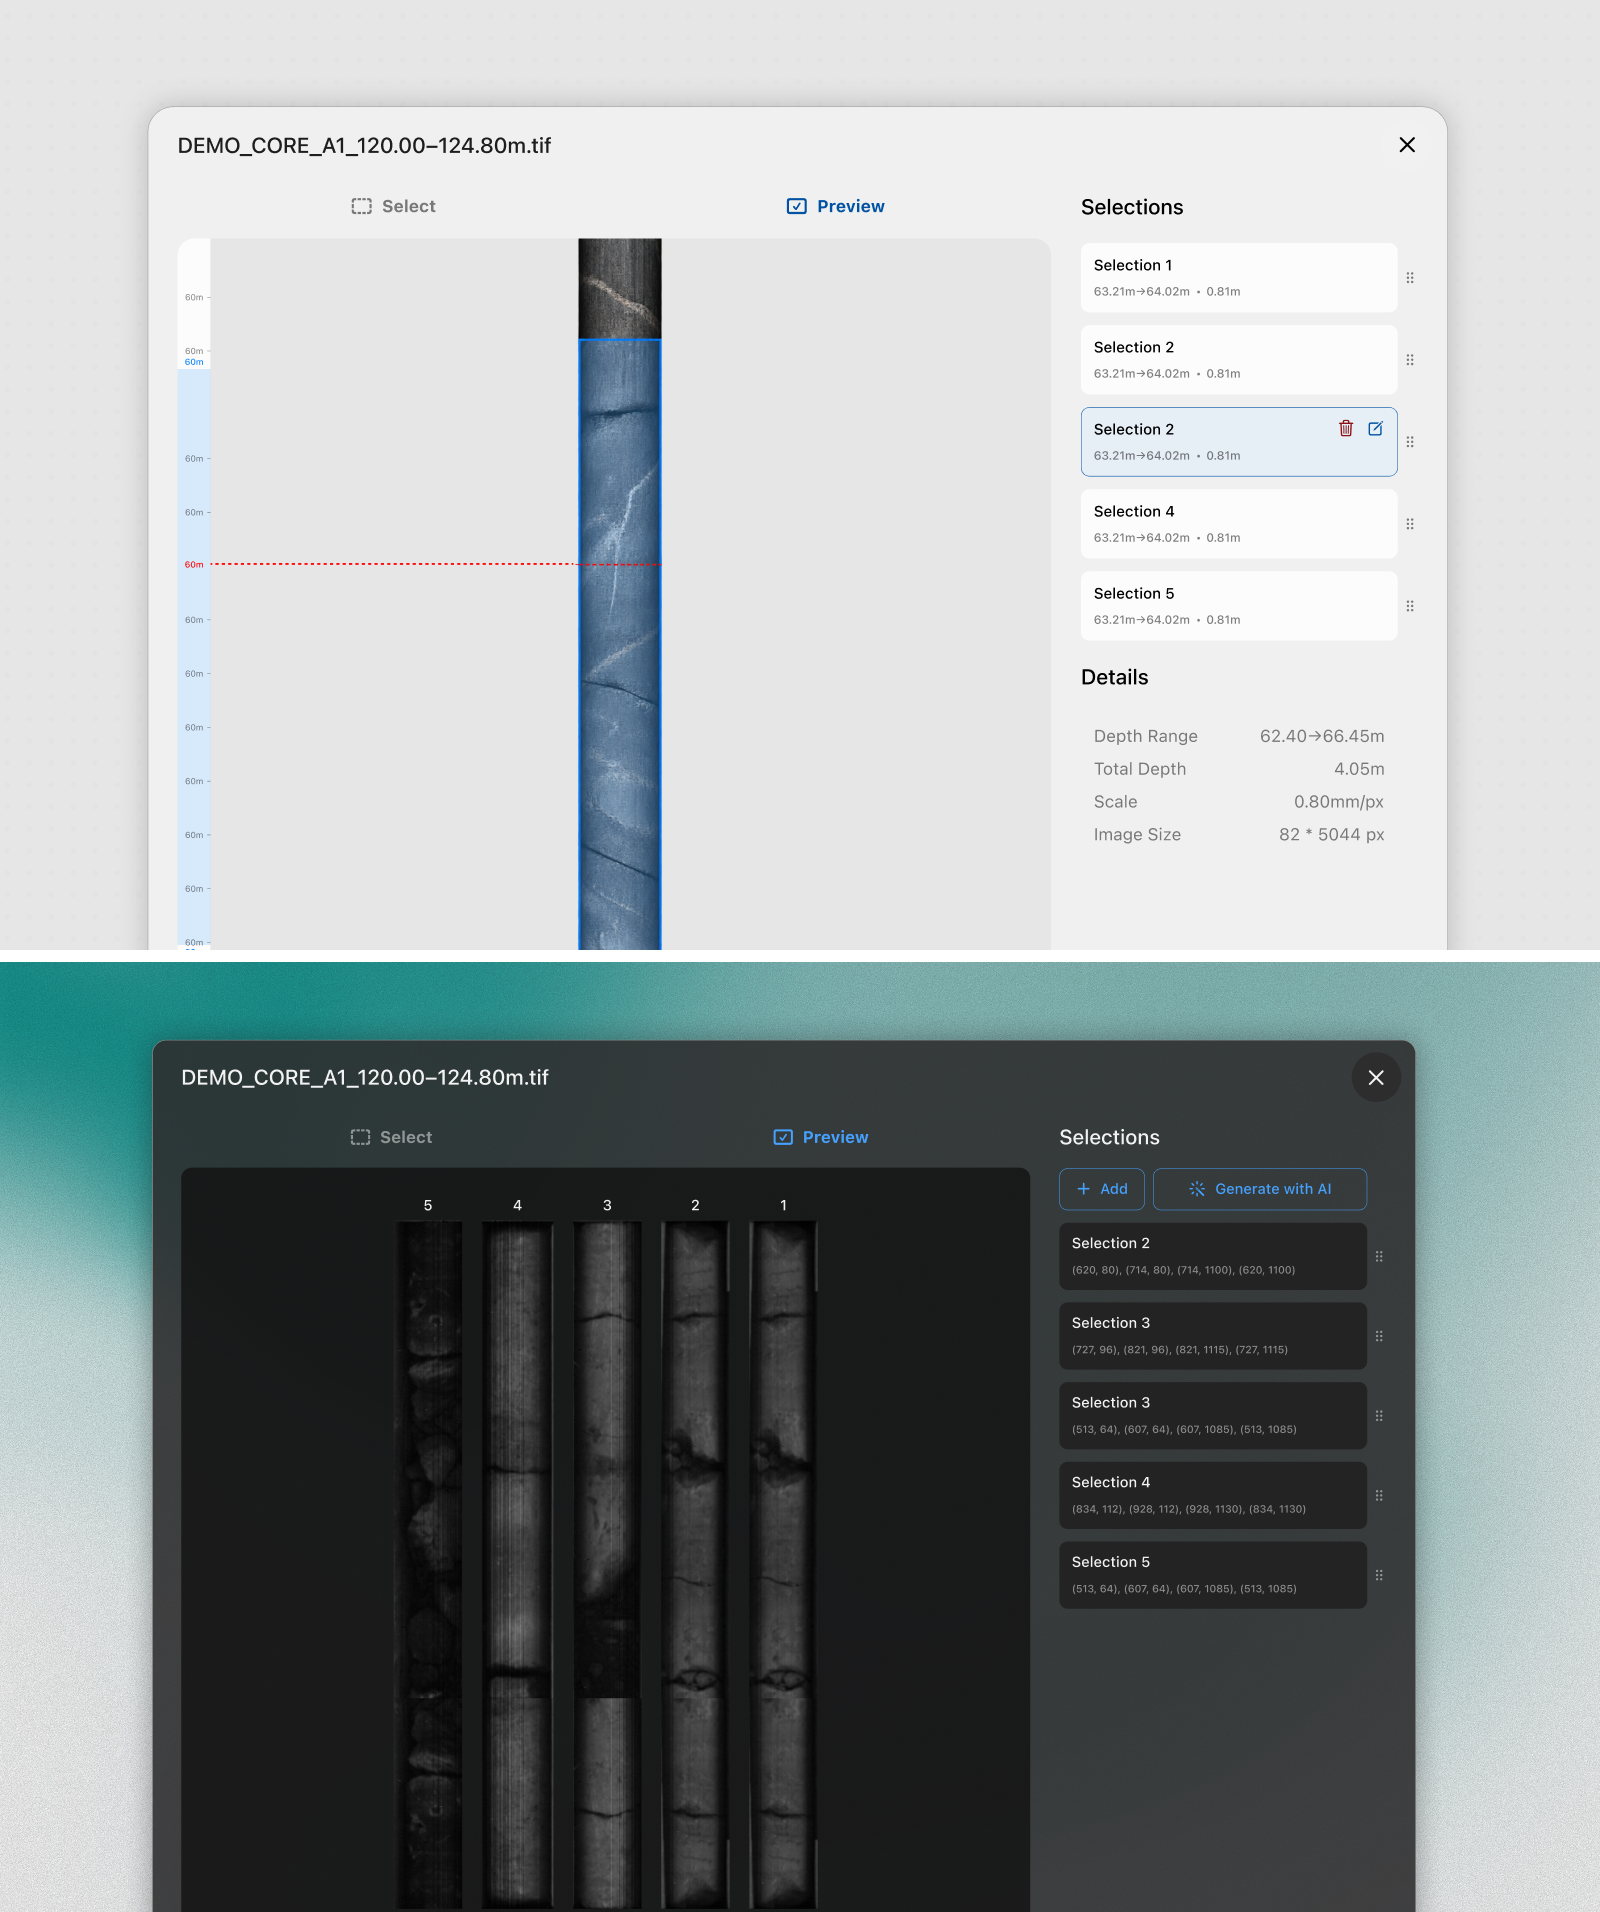
Additional refinements focused on reducing workflow interruptions and visual clutter. Segment previews were moved into a separate dedicated view instead of constantly appearing below the canvas, processed and unprocessed boxes became visually distinguishable through status indicators, and unnecessary AI-related metadata was removed to keep attention centered on the geological task. I also explored several alternative workflow structures while trying to reduce repetitive navigation and improve operational continuity, although some ultimately proved less effective. One early direction reorganized the annotation flow into sequential stages for detection, correction, editing, preview, and validation. While this initially appeared cleaner conceptually, it introduced unnecessary friction into a workflow repeated hundreds of times across large geological datasets. Users would have needed to confirm actions and move between stages repeatedly instead of remaining focused inside the workspace.
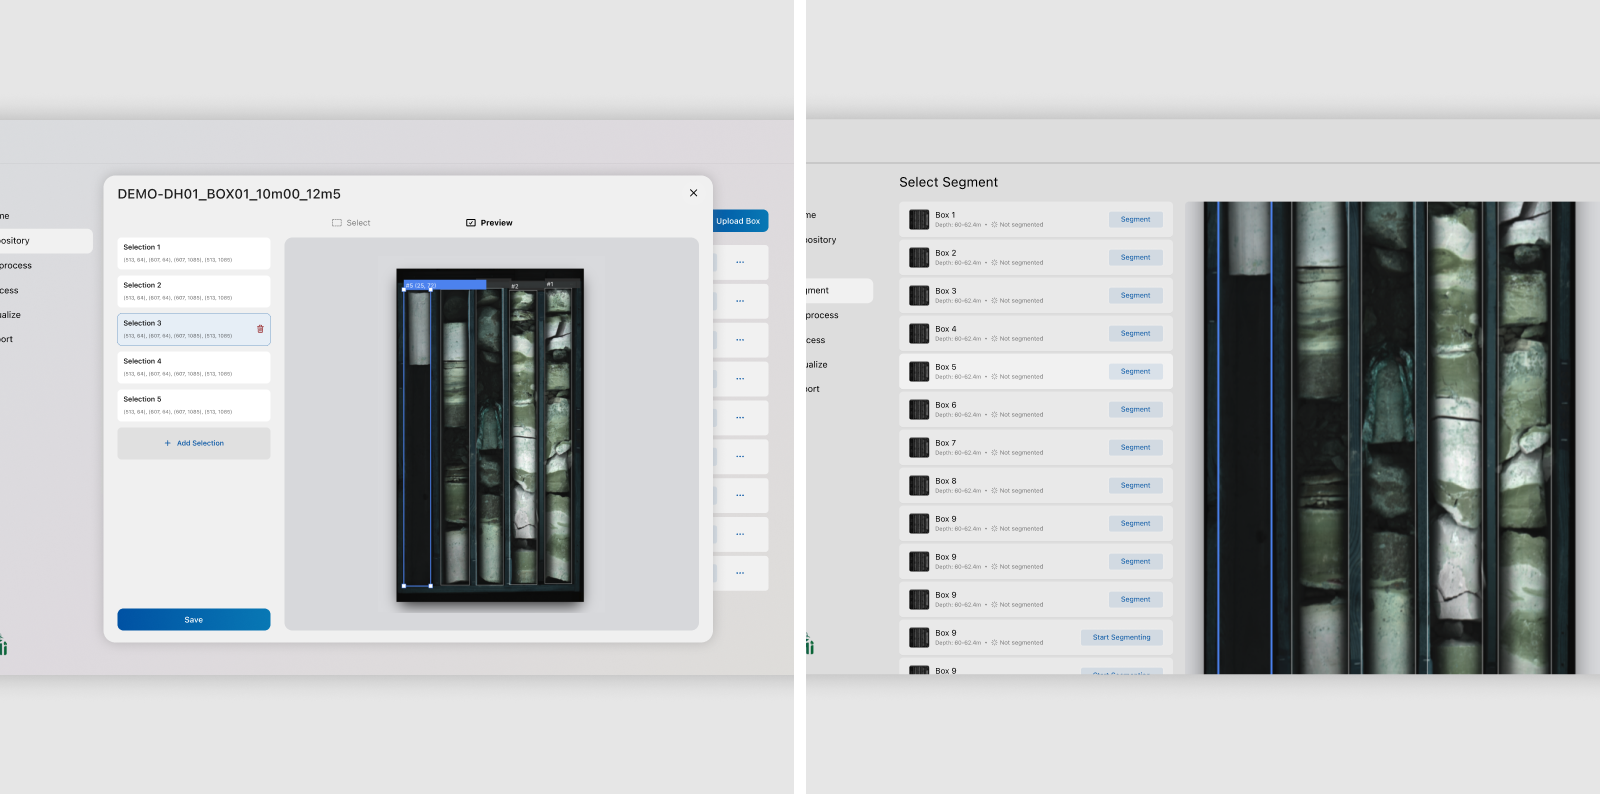
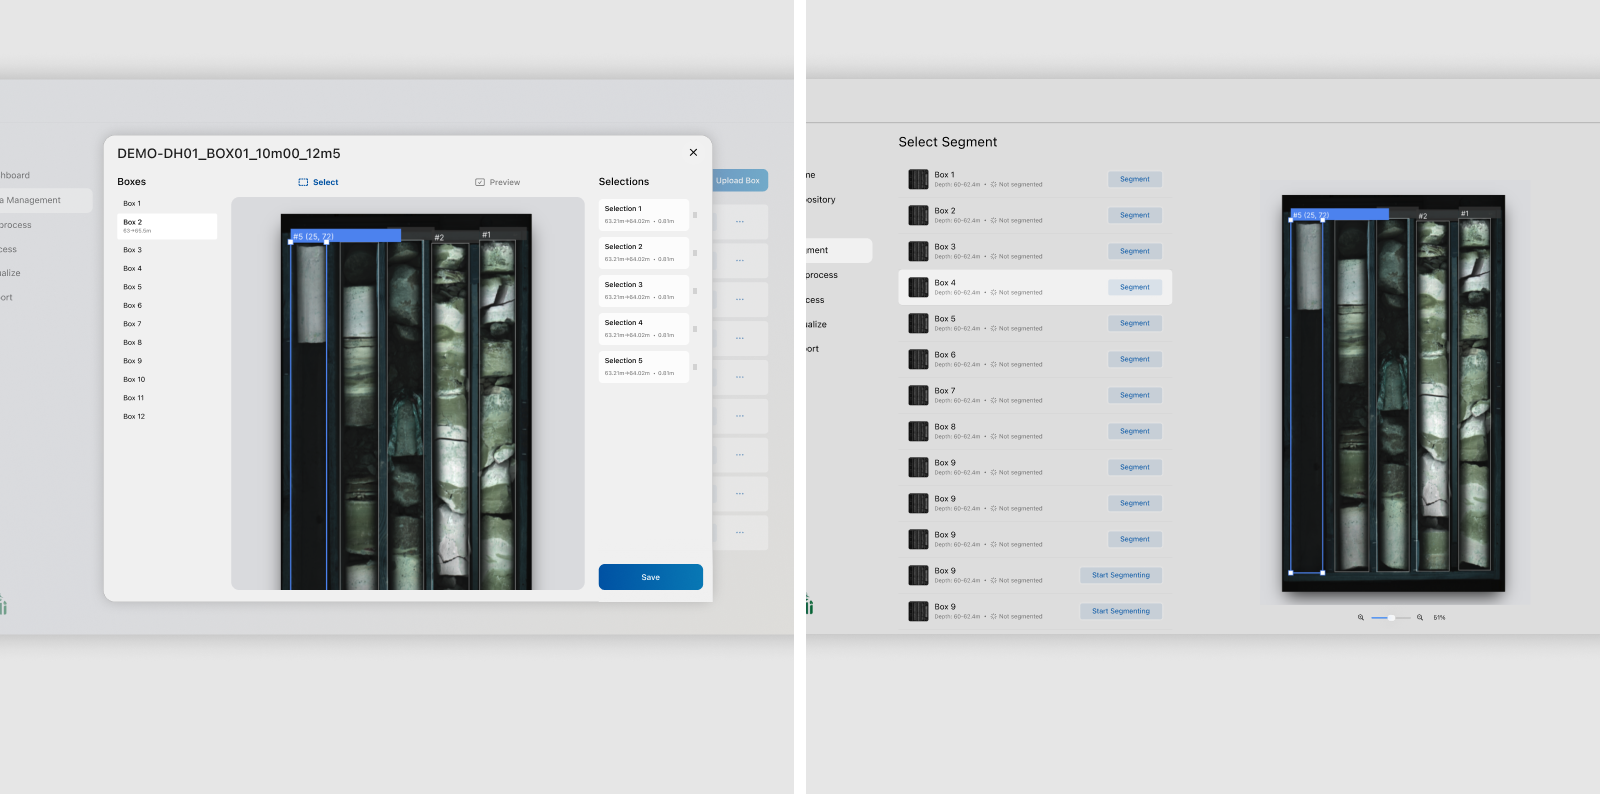
Another explored direction involved turning drill core boxes into tab-like navigational elements inside the annotation interface so geologists could move between boxes without repeatedly leaving and reopening the workflow. This direction also began changing the nature of the interaction itself. Once users were expected to spend long periods continuously navigating and processing boxes within the same workspace, the flow no longer behaved like a temporary modal task but more like a dedicated operational environment. Integrating box navigation directly into the workspace would have made a fullscreen canvas experience more viable by removing the repeated open, close, and reopen cycle. I also explored bulk operations that could apply actions across multiple boxes simultaneously. Although these ideas offered potential efficiency gains, implementing them properly required broader architectural changes outside the scope of the release. The final direction therefore prioritized preserving a more fluid canvas-style workflow centered on continuous interaction within a single operational context.
Aligning AI outputs with geological interpretation
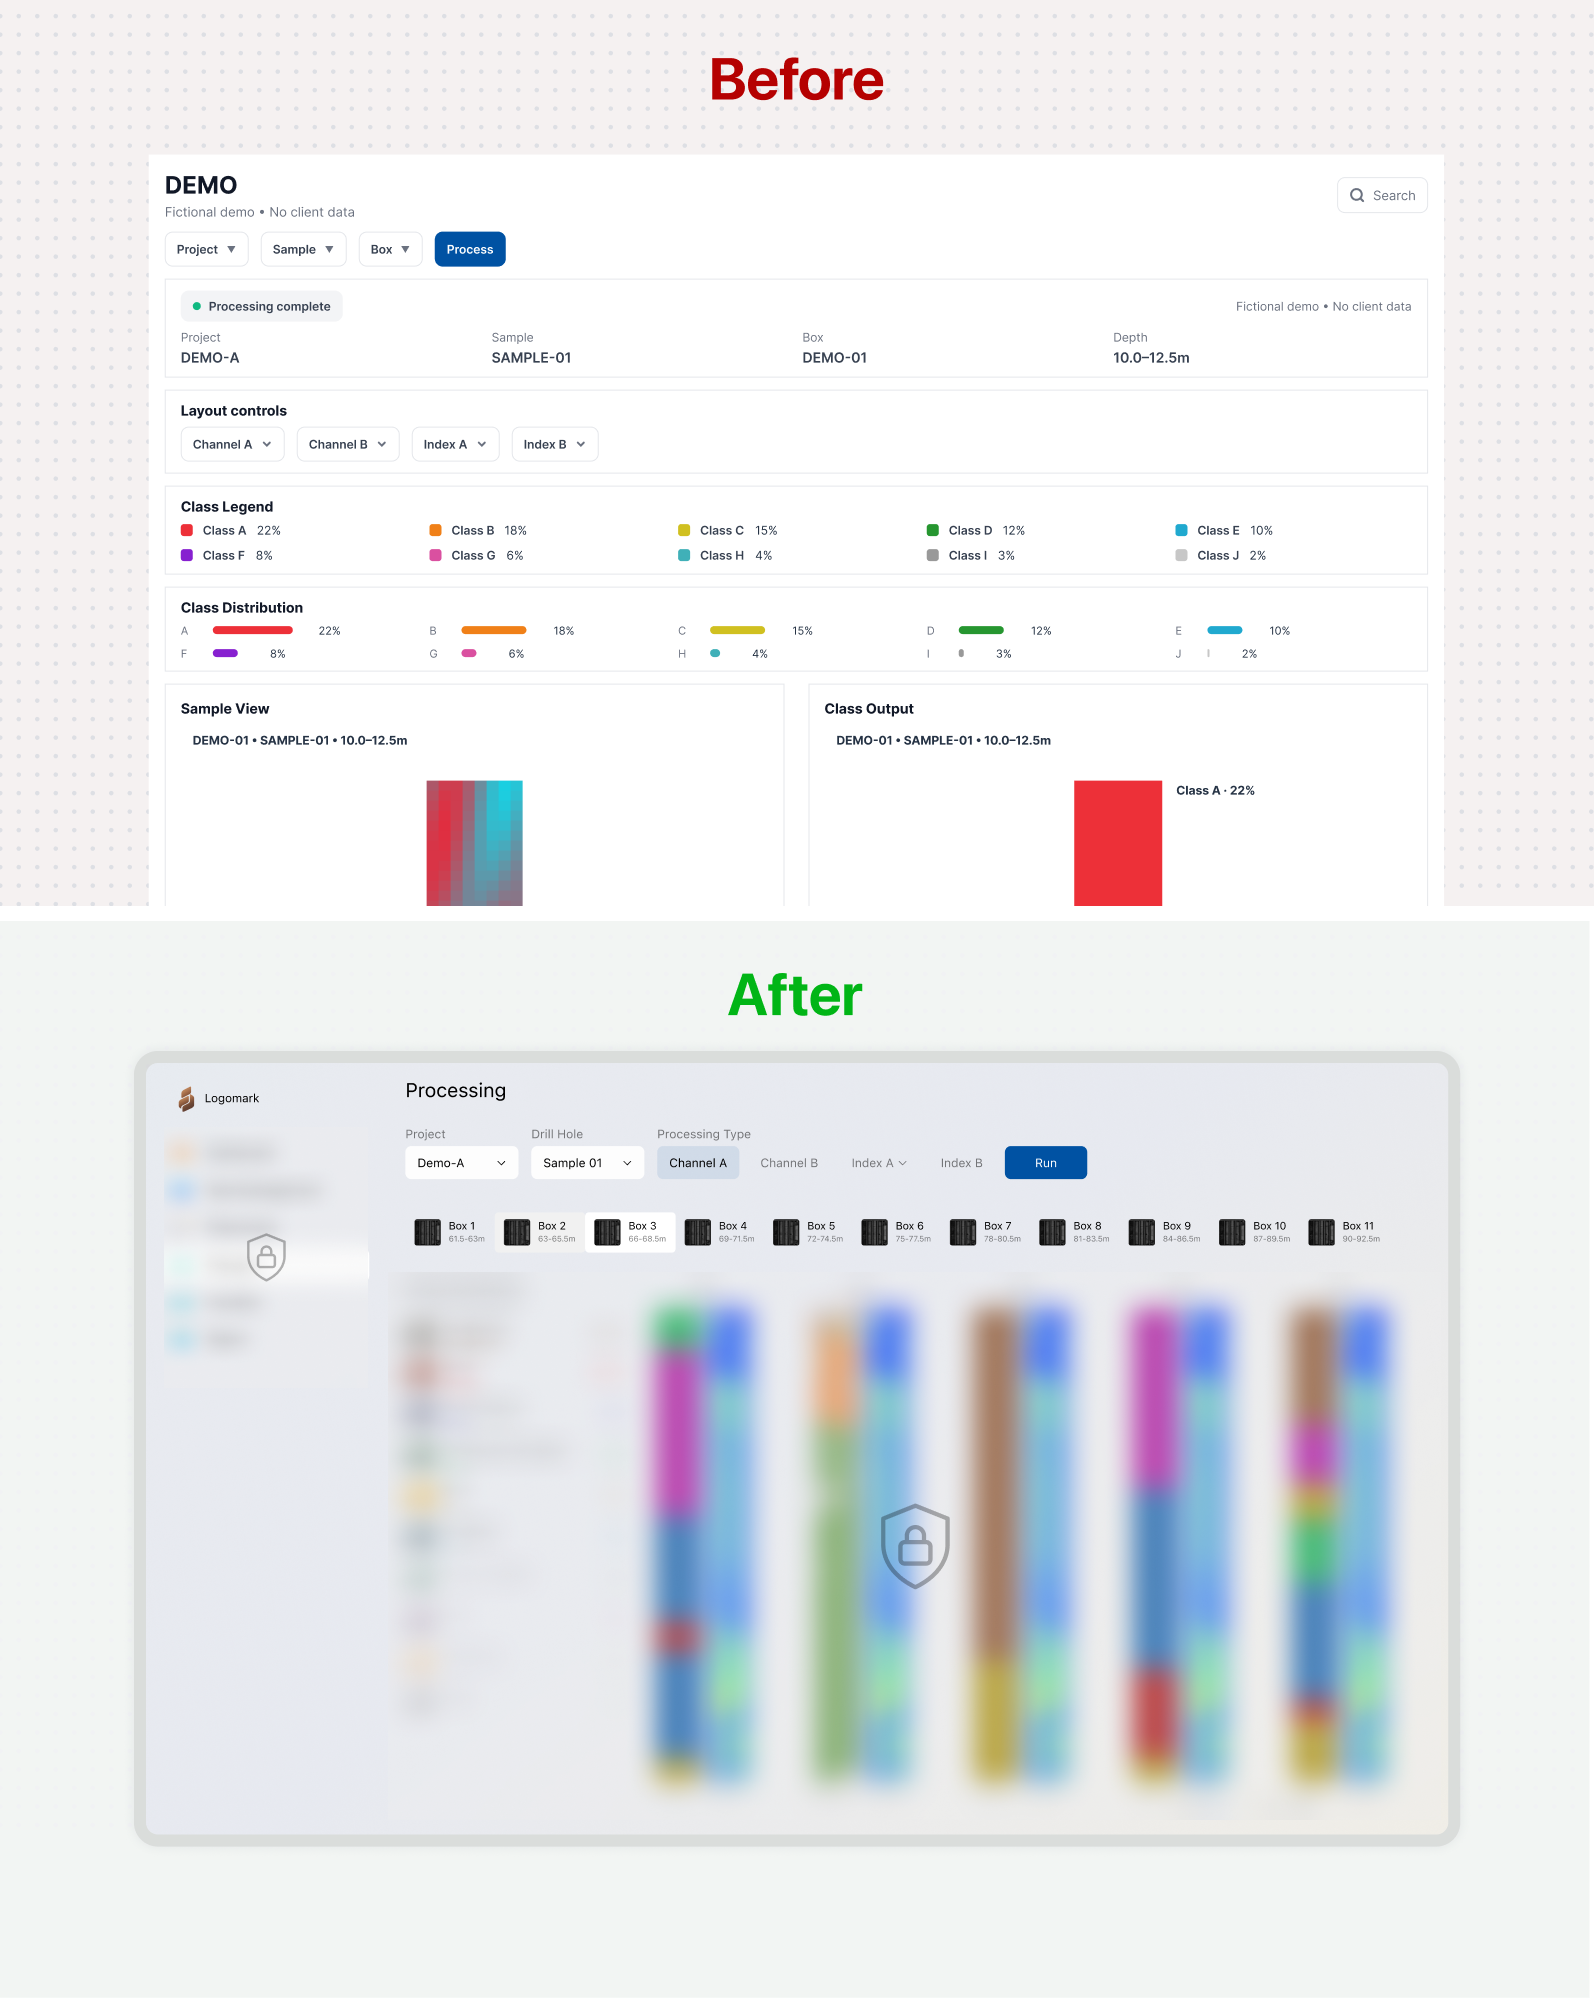
The processing and visualization modules exposed one of the clearest gaps between how technical outputs were structured and how geologists interpreted them. The earlier implementation successfully generated outputs such as heatmaps, classifications, percentages, and geological visualizations. However, geologists did not approach the platform to inspect these outputs individually. They were trying to answer broader interpretive questions that required specific charts to be viewed and compared together. The mismatch was amplified by an information architecture that had not yet been organized around this interpretation process. Charts, legends, metadata, and controls were often presented as isolated units without enough consideration for their hierarchy, relationships, or reading order. Important contextual information became fragmented across the screen, forcing users to cross-reference it manually while navigating long, vertically stacked layouts.
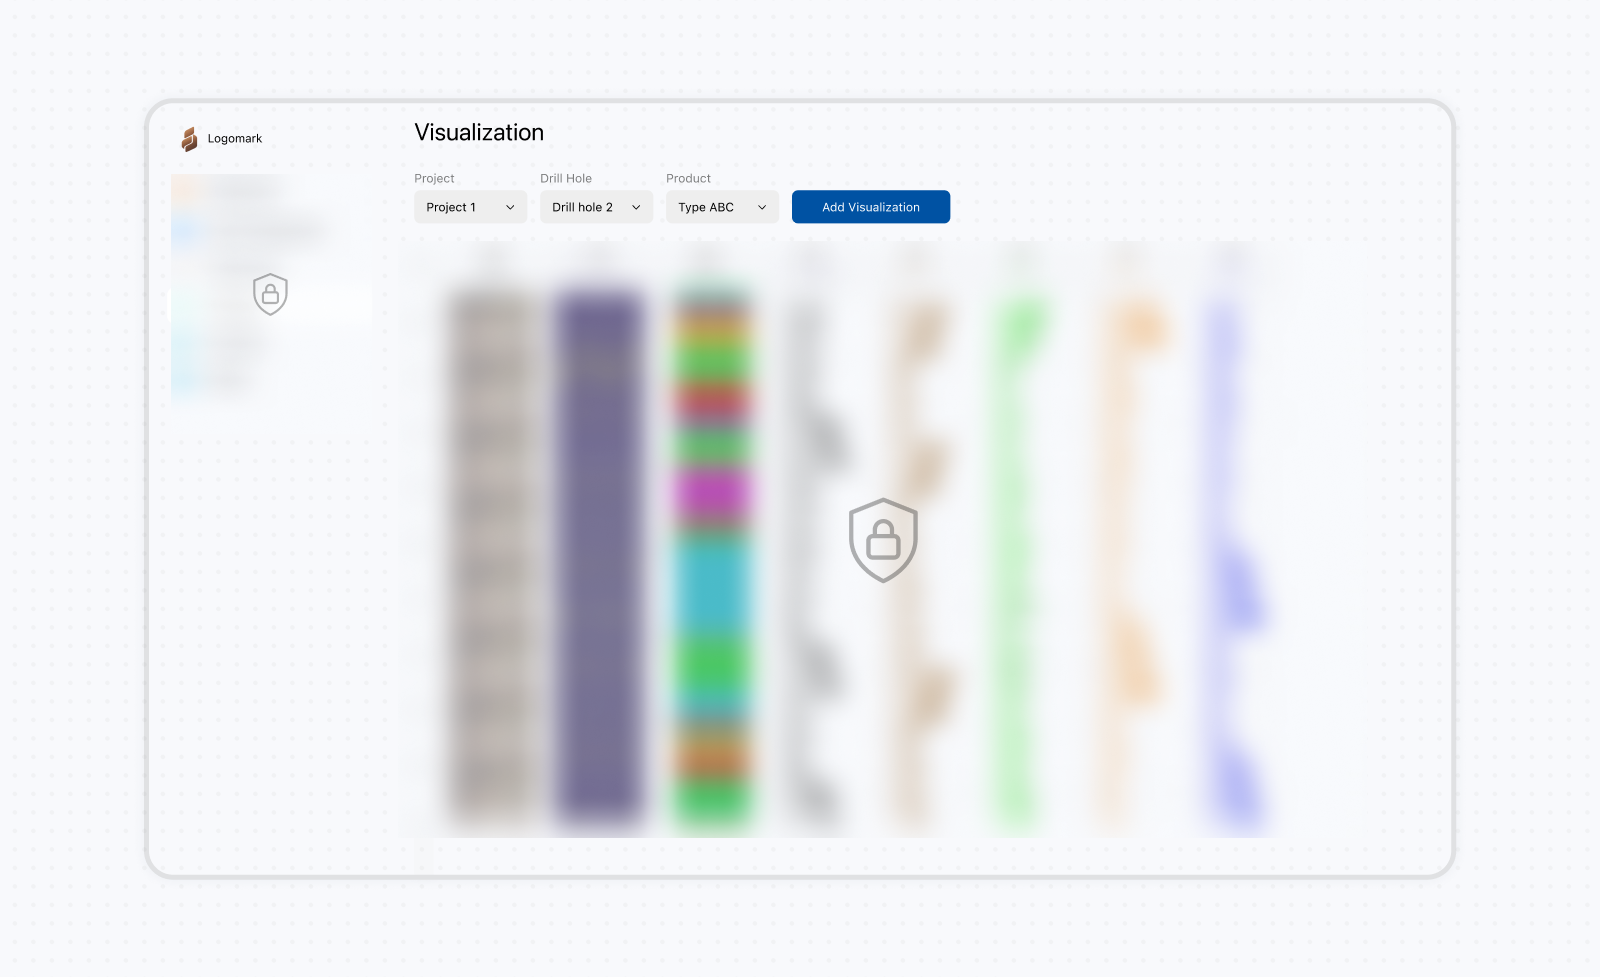
The platform did not lack analytical capability. Most of the required geological outputs already existed technically, which meant many improvements were possible without rebuilding the underlying algorithms. Aside from a few specialized charts requested later by the geologists, the greatest value came from restructuring how results were organized, compared, and interpreted. This direction became clearer after reviewing how geologists already worked outside the platform. They frequently exported charts, screenshots, and geological outputs, then placed them side by side to compare continuity, mineralogical transitions, and processing results across intervals or drillholes. Once I understood this behavior, the processing modules gradually evolved from static result pages into more flexible analytical workspaces centered on comparison and interpretation rather than isolated output presentation. The modules became customizable environments where users could choose different chart types, geological layers, minerals, and visual arrangements instead of being restricted to predefined layouts. This later supported saving customized chart arrangements and processing views as reusable report snapshots for future comparison, communication, and review.
Improving project map interactions
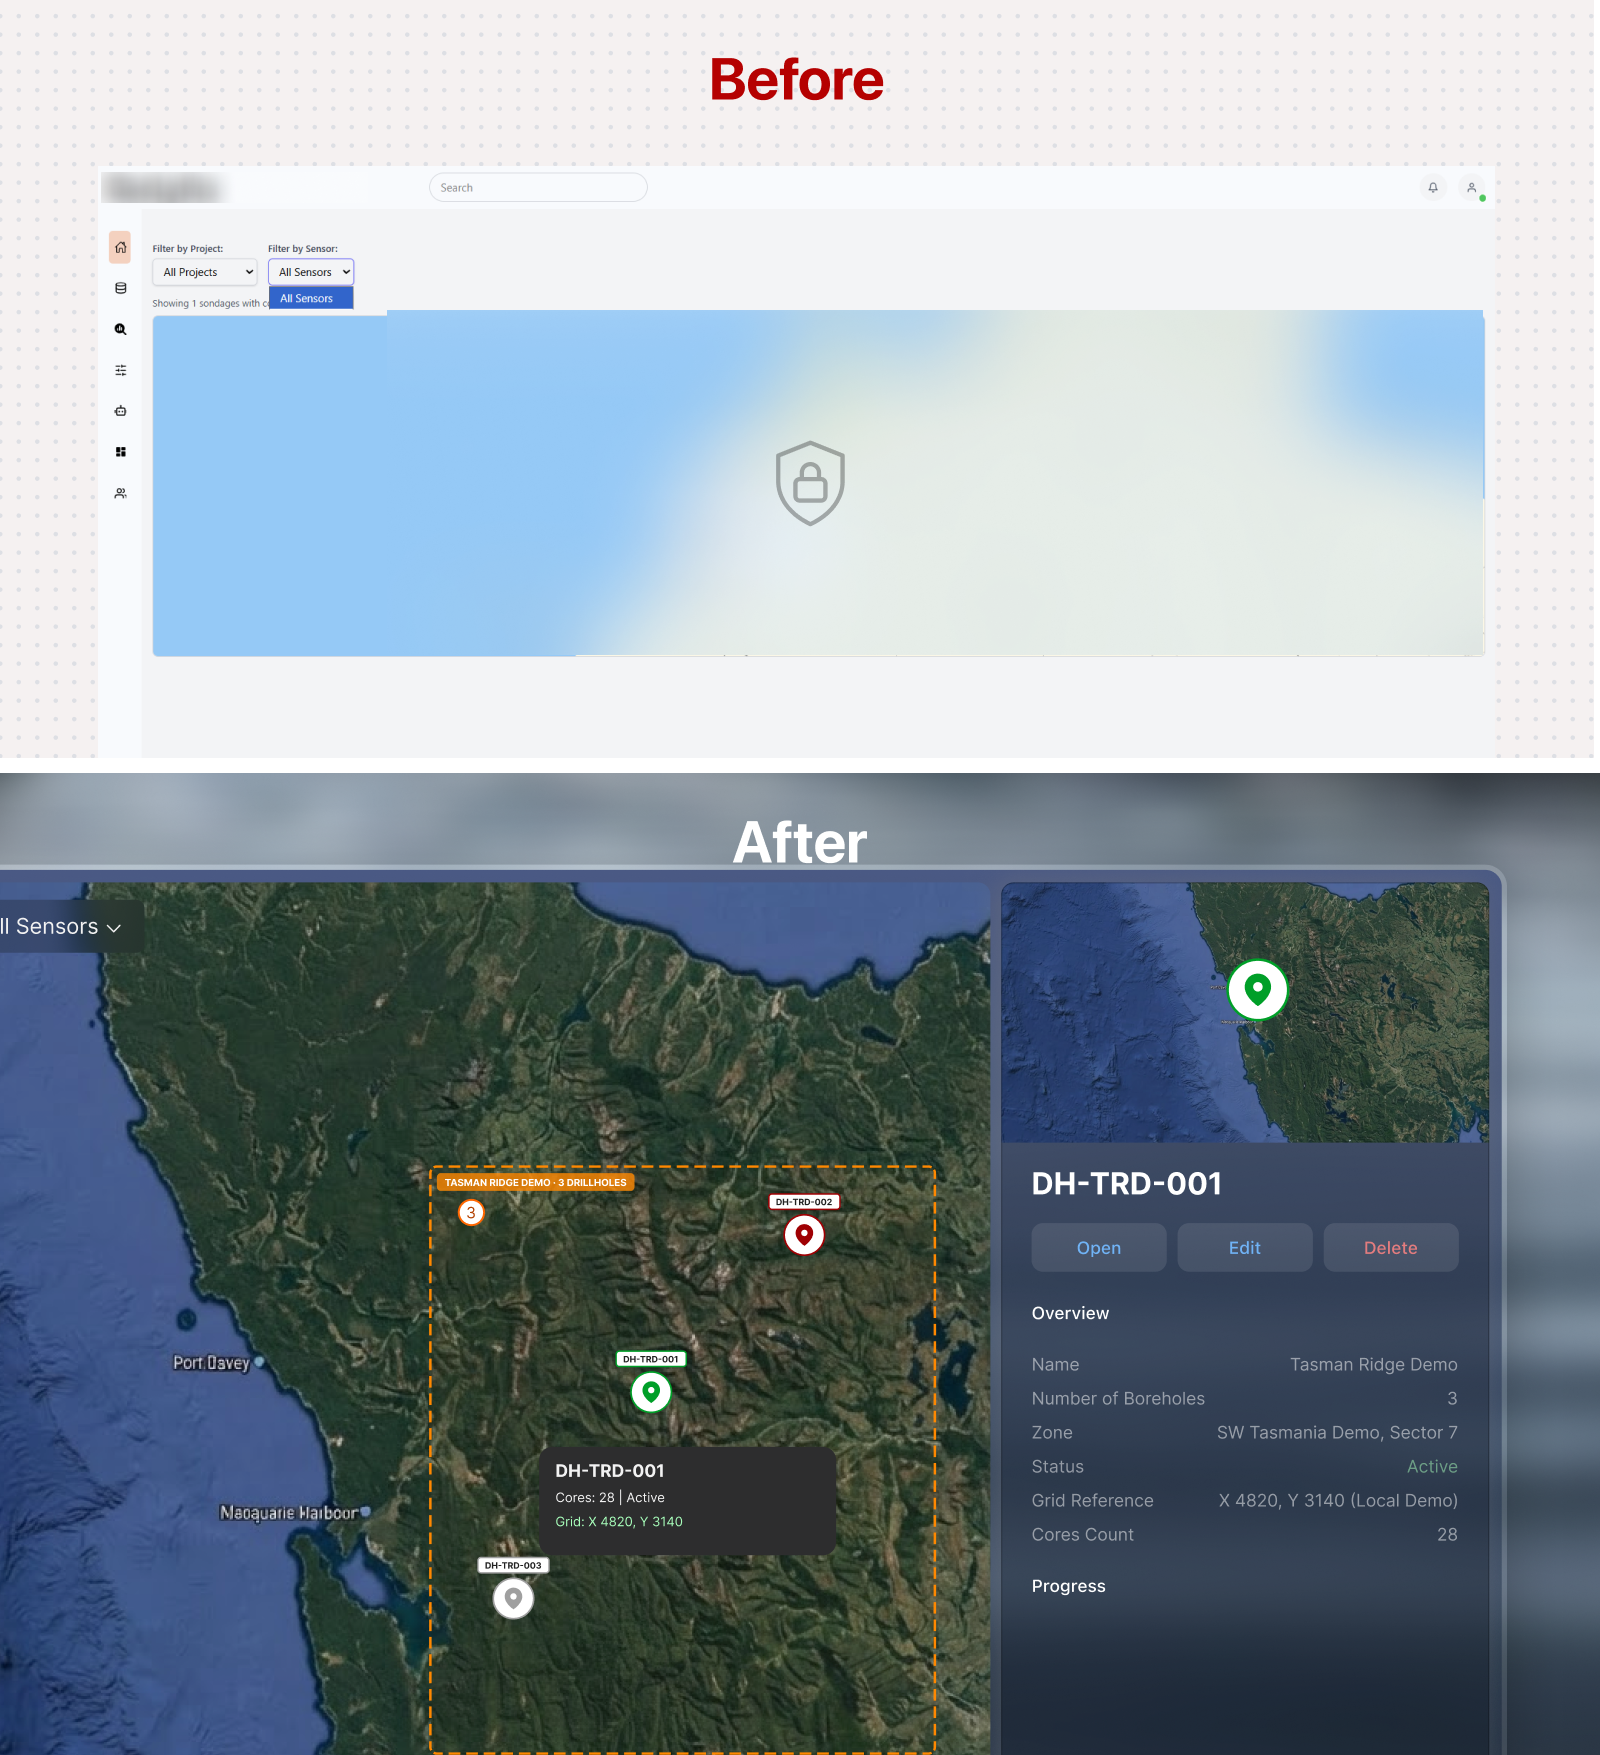
The original Projects module treated the map primarily as a location browser. Projects appeared as individual markers, and selecting one revealed a small set of general details. However, the underlying structure was more complex because each project contained multiple drillholes distributed across an exploration area. Geologists needed to understand not only where each drillhole was located, but also which project it belonged to. I used distinct marker treatments and visual connections such as dotted lines to communicate this relationship directly on the map. Project and drillhole selections also behaved differently. Selecting a project displayed information about the overall exploration project, while selecting a drillhole revealed its own details, processing status, and current position in the workflow. This allowed users to move between the broader project context and the individual drillholes without losing the relationship between them.
The map also needed to remain usable as the number of projects and drillholes increased. Nearby markers were grouped at wider zoom levels and revealed individually as users zoomed in. Their colors and interaction states remained visible across standard and satellite map layers. Hovering over a marker provided a quick preview, while selecting it opened the relevant information in a side panel without removing the surrounding map context. For the details panel, I initially proposed a dismissible panel layered within the full-screen map, similar to Google Maps, because it preserved more space for the map and could be hidden when not needed. The primary stakeholder preferred a fixed side panel because it created a clearer separation between the geographic context and the operational details. We adopted that direction, accepting slightly less map space in exchange for a stronger information hierarchy and more predictable access to project and drillhole data. I also reorganized the filters and controls so users could find and access specific projects and drillholes more efficiently.
Improving geological data management
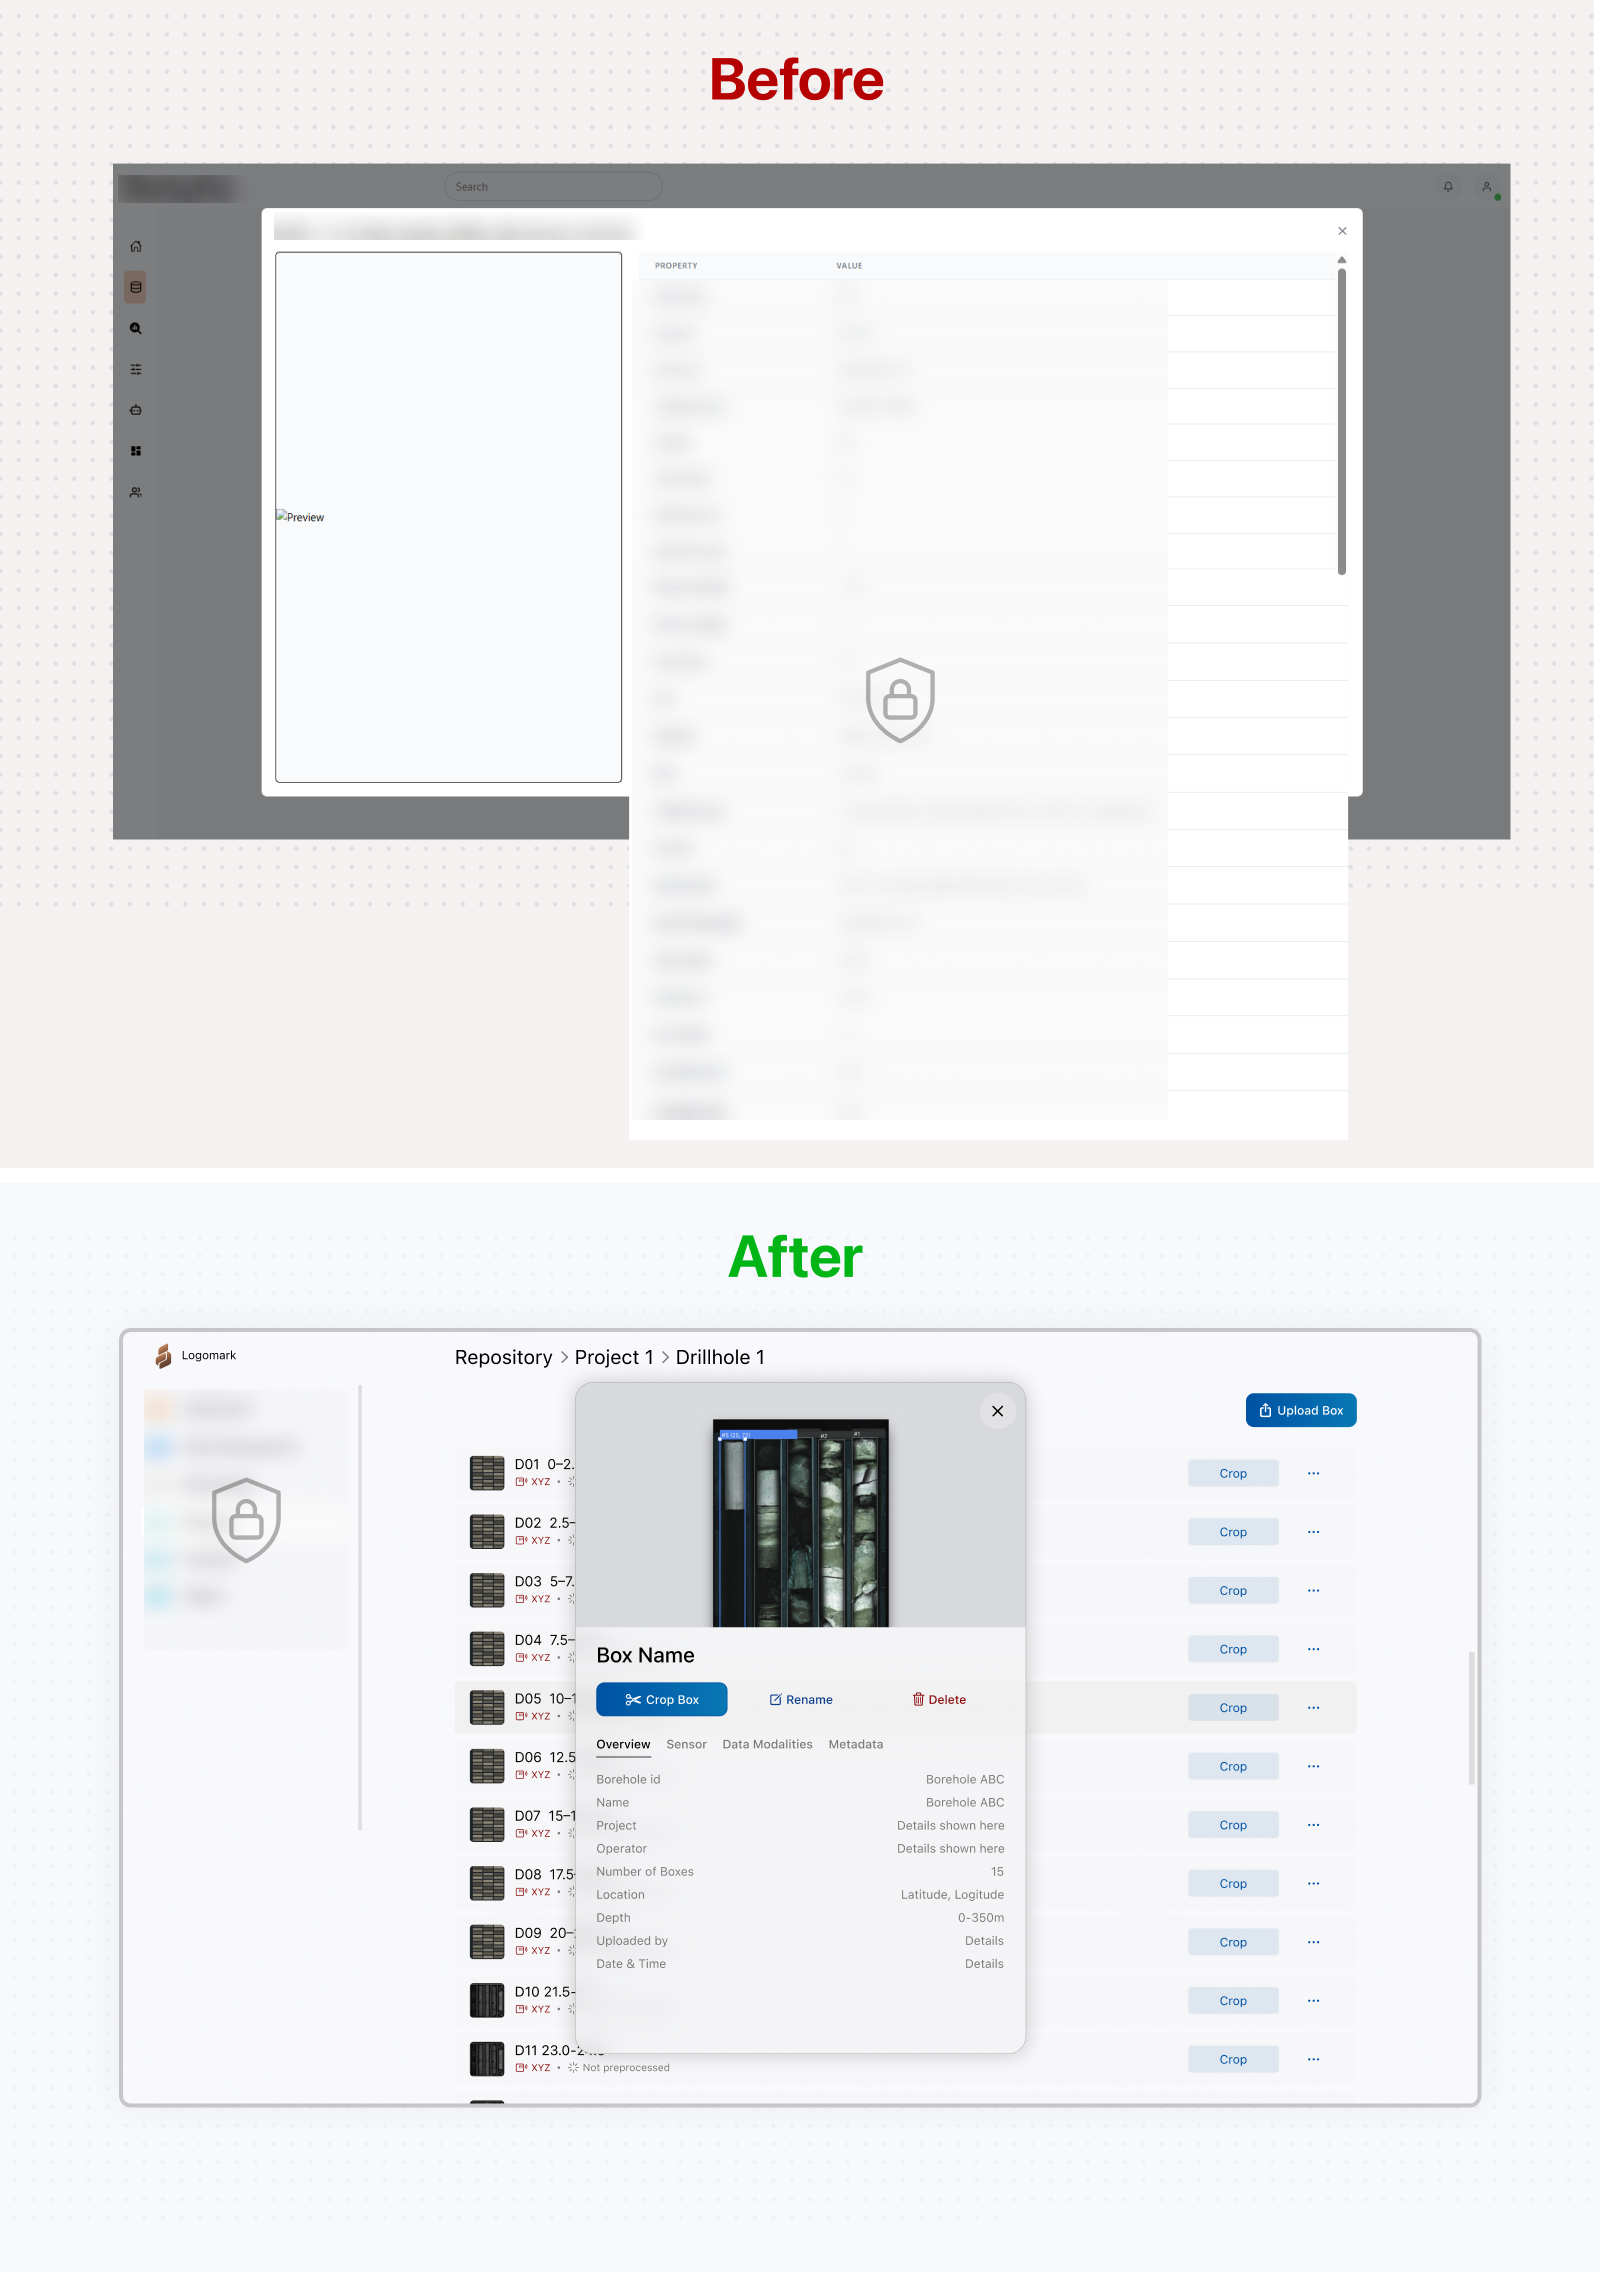
Managing exploration data required users to move through a hierarchy of projects, drillholes, and core boxes. The original module treated these items mainly as technical records, with long metadata lists and separate actions that provided little sense of location or relationship. This made it difficult to understand where an item belonged, move between levels, or access the information needed for the next task. I reorganized the module around a familiar repository model similar to a file explorer. Projects formed the top level, with drillholes and their core boxes nested beneath them. Breadcrumbs preserved the user's location, and structured lists made names, previews, status, and available actions easier to scan. Selecting a box opened a contextual panel with its image, relevant metadata, and actions without removing the surrounding repository context.
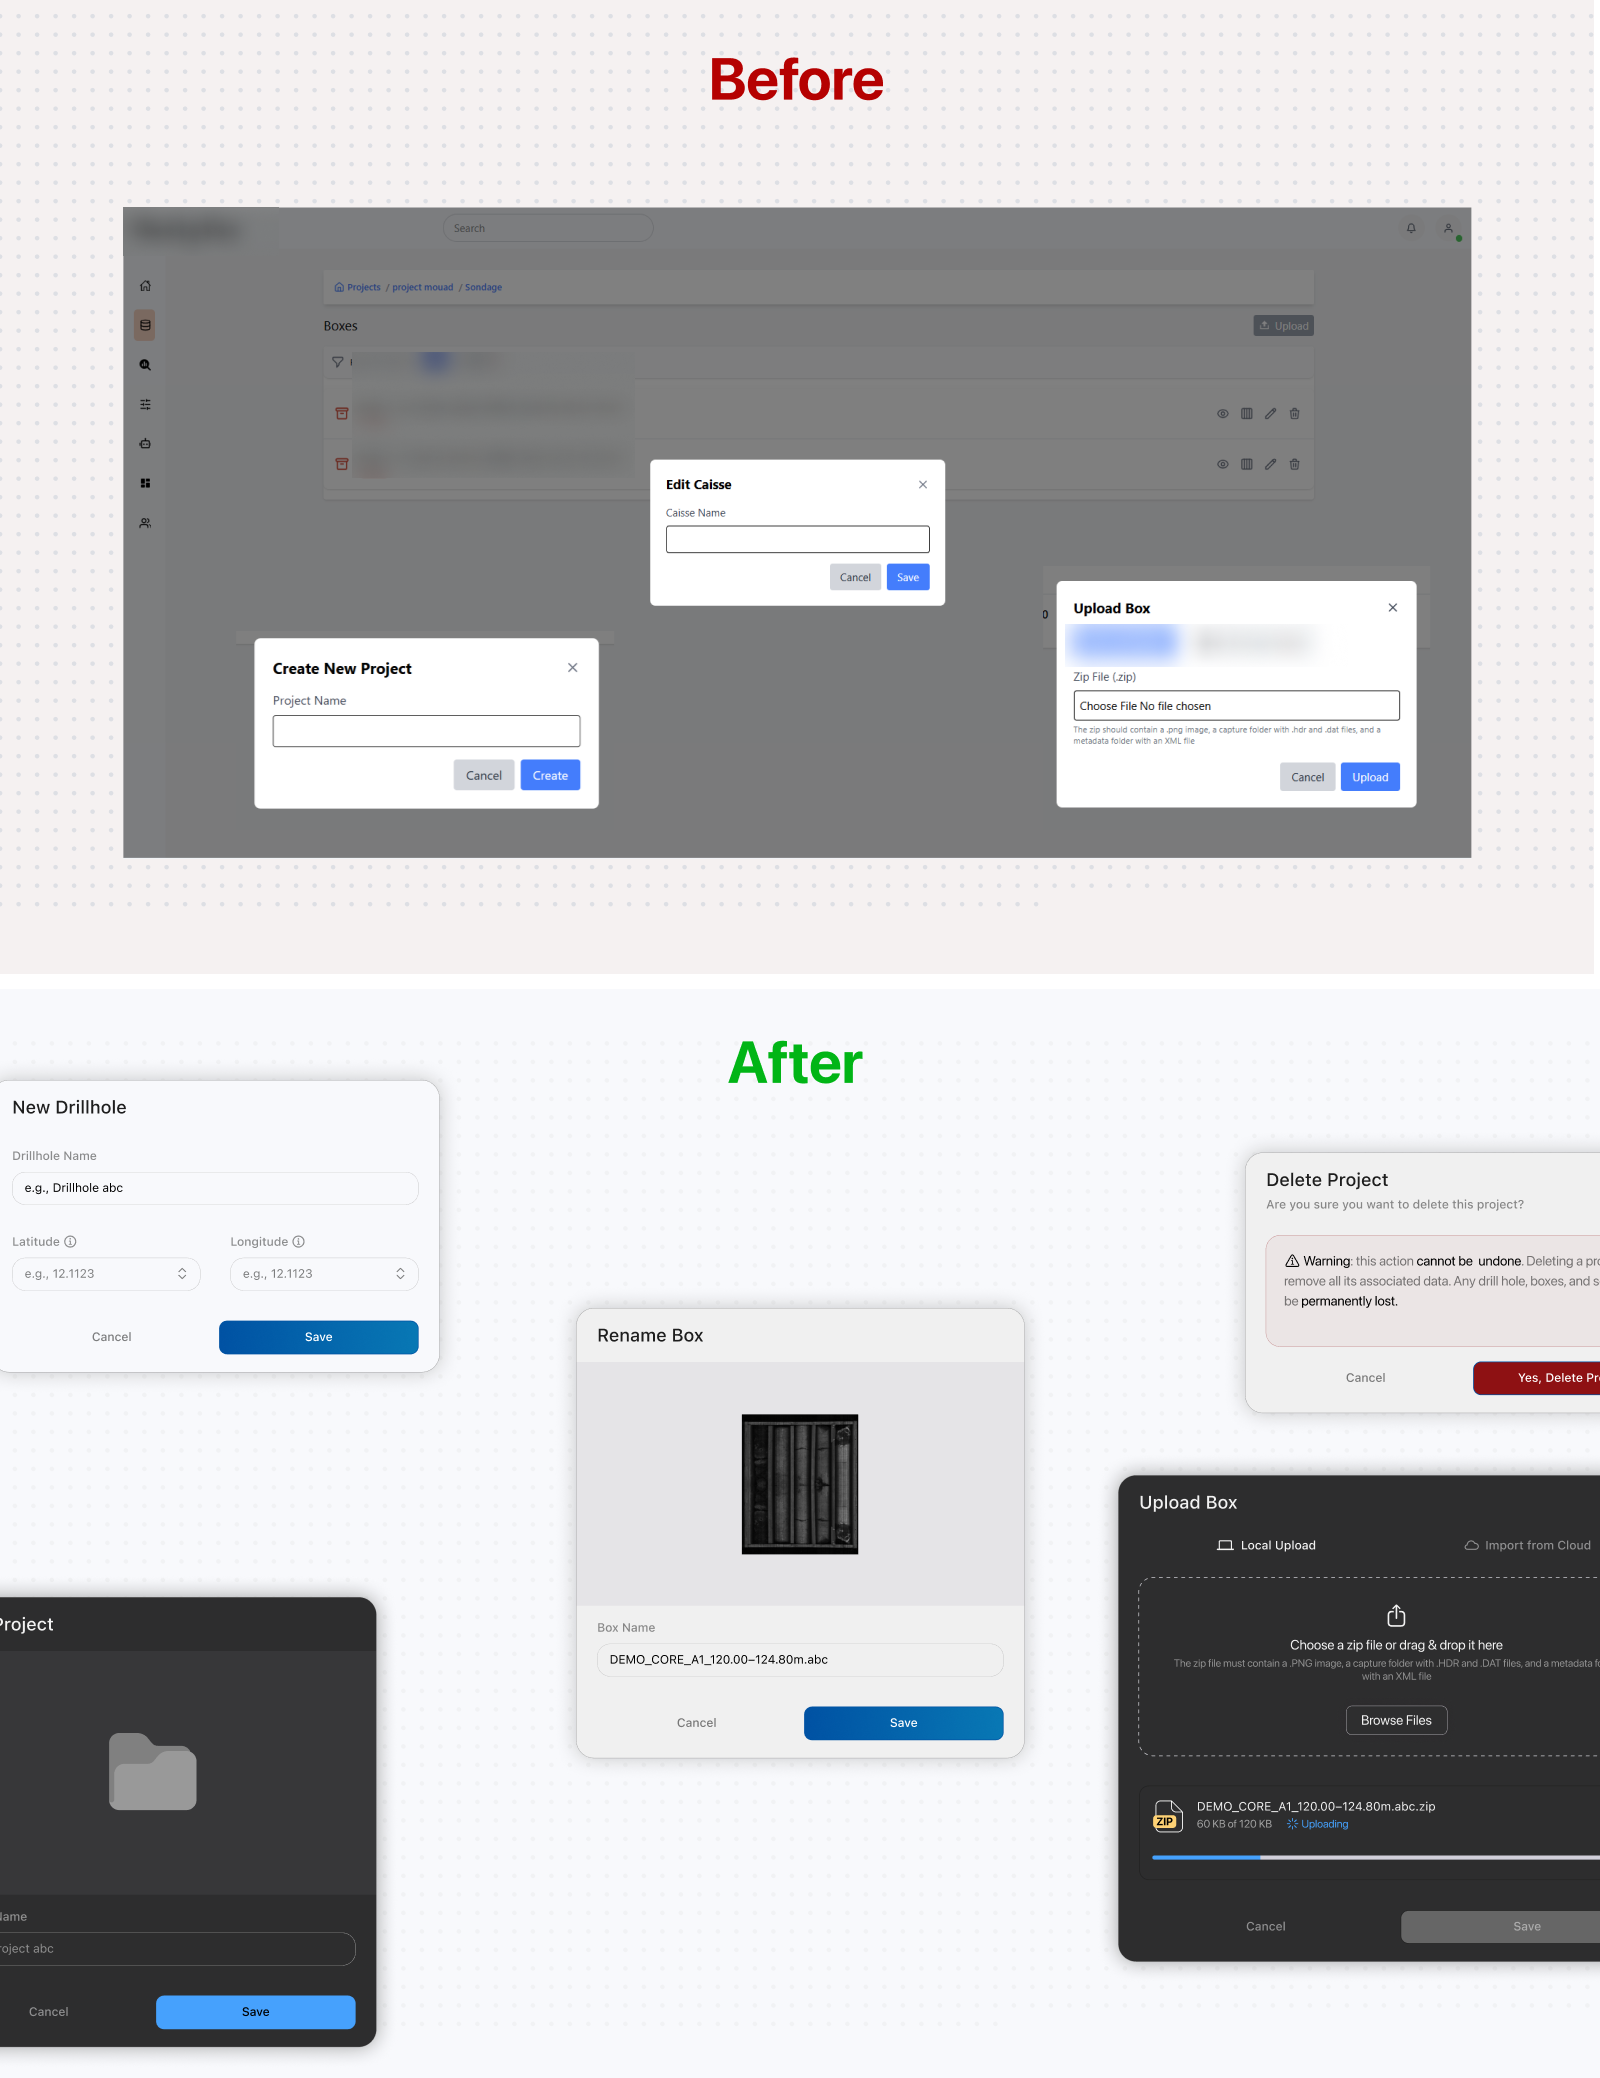
The supporting interactions already existed, so I focused on improving their usability and consistency rather than changing the underlying flows. I clarified field behavior and feedback states, improved upload progress and file-status communication, used stronger color cues for destructive actions, and reduced the scrim opacity so users retained more context while working inside a modal. Similar refinements were applied across the create, rename, upload, and delete flows.
