Designing a Unified Performance Management System for a Global Multi-billion dollar Manufacturer
A look at the UX process and key decisions and tradeoffs behind a global manufacturer’s performance platform, spanning executive dashboards, operational reporting, contextual comments & communications, data management, and consumption management workflows.
Note: this case study focuses on UX design decisions. Sensitive operational data has been removed or replaced with illustrative values, and confidential details have been omitted.
Context & Role
I joined this project as the Senior UX Designer responsible for the platform’s end-to-end user experience. Adoption was a central consideration from the outset. The platform’s users were senior executives, site directors, operational managers, and performance teams with established mental models built through years of operational reporting and decision making. Understanding their reporting practices was essential to shaping the experience. I established the value of research and validation within tight delivery timelines.
I led research, information architecture, interaction design, prototyping, and validation while requirements and development evolved in parallel. Some workflows moved from initial investigation to validated designs within days, with limited time for research. The two project leads helped clarify requirements and manage scope, while domain experts, stakeholders, and users explained operational practices, challenged assumptions, and tested design directions. Data engineers and scientists helped me understand the underlying data, while developers collaborated through annotated prototypes, workshops, and walkthroughs when timelines left little room for formal specifications.
Business Context & Problem
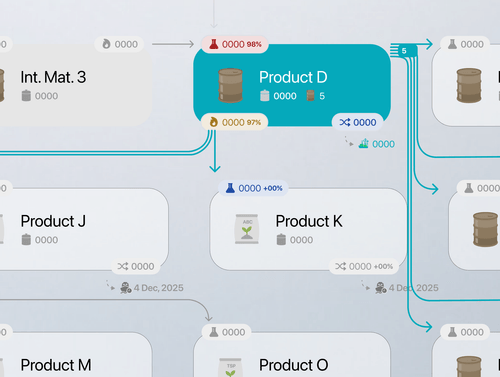
The client is a global manufacturing group with operations across multiple industrial sites. Its interconnected manufacturing ecosystem spans production, transformation, utilities, exports, logistics, maintenance, quality, and stock management. As operations scaled, understanding performance across these activities required piecing together Excel files, PowerPoint reports, enterprise-system extracts, emails, and manually assembled summaries. Teams worked with different KPIs, reporting structures, and update schedules, making it difficult to establish a shared view of performance and trace deviations across sites. The project expanded an earlier site-level initiative into a broader manufacturing performance platform. The challenge was to bring fragmented reporting into a shared system that supported both executive oversight and detailed operational investigation.
Solution & Impact
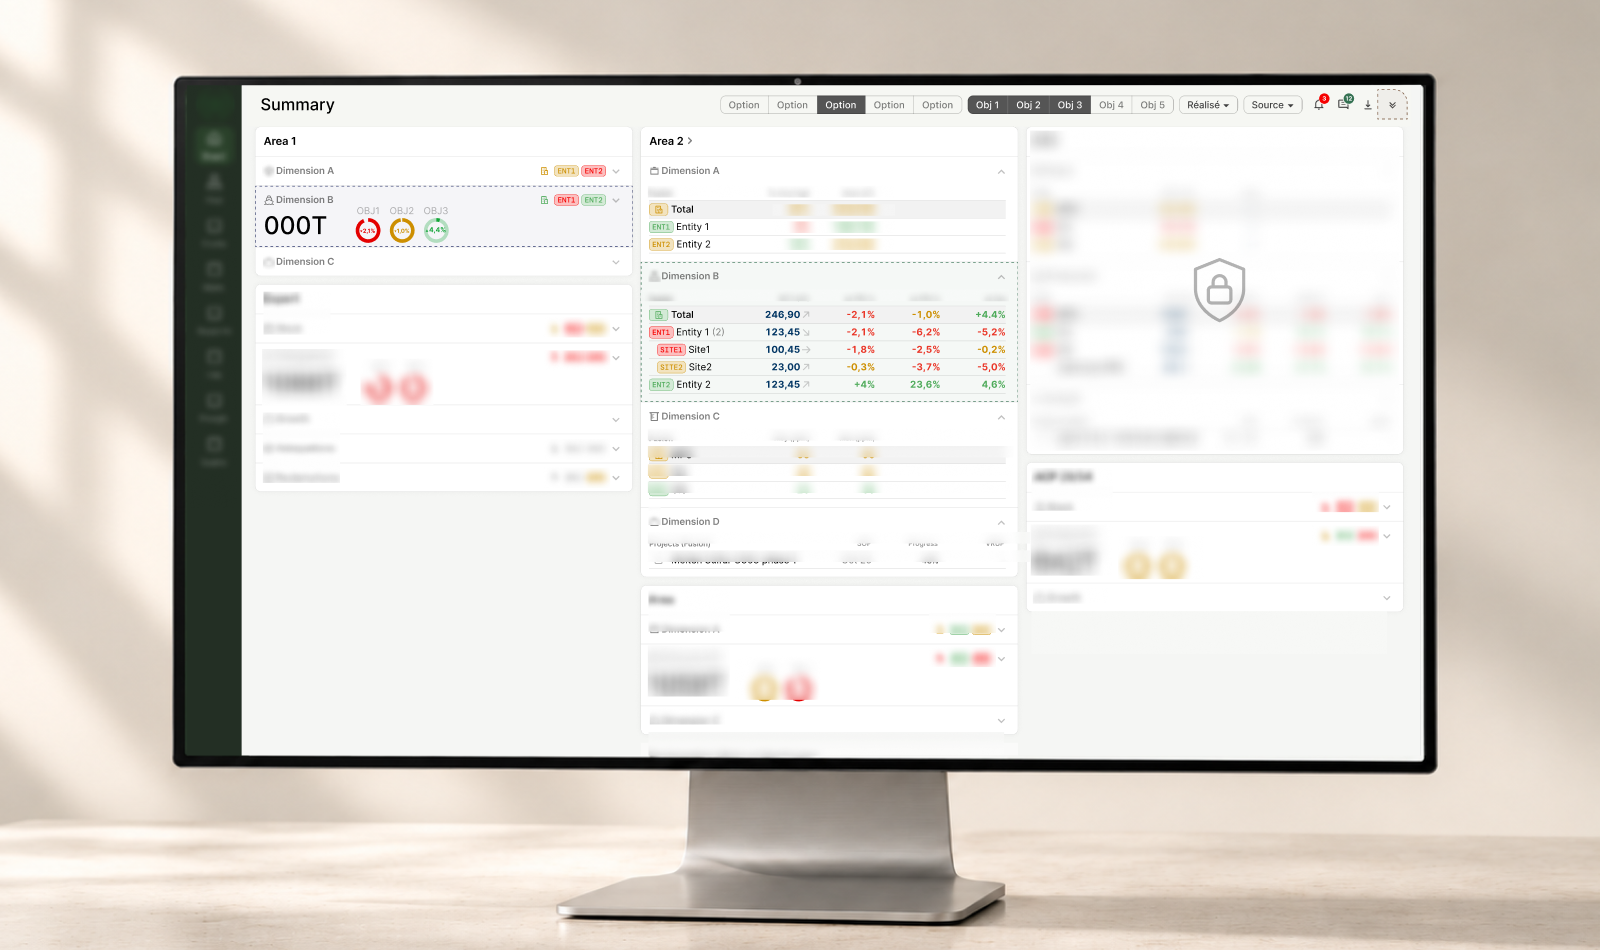
The platform brought executive oversight, historical performance reporting, and operational explanations into one shared environment, building on existing enterprise-system data and reporting inputs. Users could identify deviations, investigate them across sites and products, and review related causes and action plans without piecing together separate spreadsheets and presentations. Early design work also addressed practical barriers to adoption, including how teams uploaded data and how that data connected across reporting contexts. The rollout followed a gradual approach to support adoption. Teams first integrated each delivered module into their operational routines to assess whether it supported their work before extending the platform further. This allowed its value to be assessed through actual use alongside stakeholder reviews and validation sessions.
One of the clearest early signs of value was how the scope expanded. What began as a request for an Executive Summary dashboard grew into historical production reporting after the dashboard was well received. As teams used the platform and saw value in it, they requested additional workflows for communication, consumption reporting, and eventually consumption management. The platform is still being tested within operations, and reductions in reporting time and manual effort have not yet been measured. The strongest evidence so far is its use in those routines and the growing demand to support additional workflows. It is worthwhile to note that one limitation of using adoption as a success signal is that users in B2B contexts often adapt to friction rather than report it. Within the project’s delivery timeline, continued use could not confirm that all usability issues had been resolved. Follow-up observation would help identify repeated workarounds and unnecessary steps that had become part of users’ routines.
Domain Understanding, Research, & Validation
Early discovery involved executives, site directors, performance managers, and operators with limited availability. The product scope was also still evolving which made it difficult to establish requirements through discussion alone. I started with domain immersion before relying on formal user research. Three inputs became essential: access to every relevant reporting artifact, a deep understanding of the manufacturing reality from the full value chain down to specific entities, production lines, KPIs, constraints, and terminology, and analysis of existing dashboards. I first built context around the client’s operating model, manufacturing operations, performance processes, and entity-level specifics by speaking with domain experts across the organization, not only target users. I then deconstructed the reports as operational artifacts, not just documents. Each file was considered a response to a real operational problem, revealing information hierarchy, reporting priorities, decision models, terminology, chart choices, and the mental models behind them. This compressed discovery significantly and made later stakeholder conversations more concrete and productive. Much of this work had to run alongside design and development within the available discovery timeline. It provided essential context, but required continually revisiting assumptions as my understanding of the domain developed.
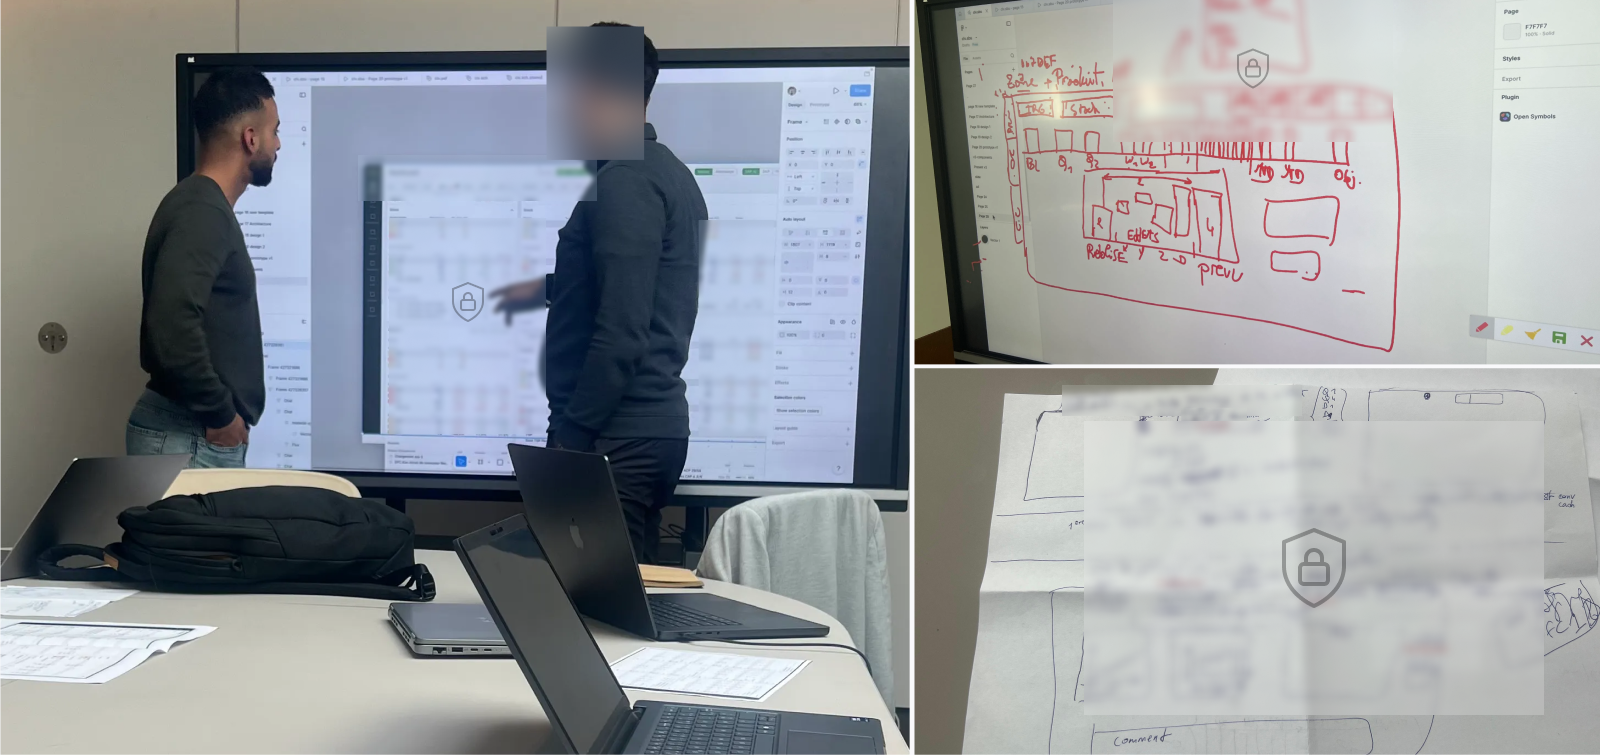
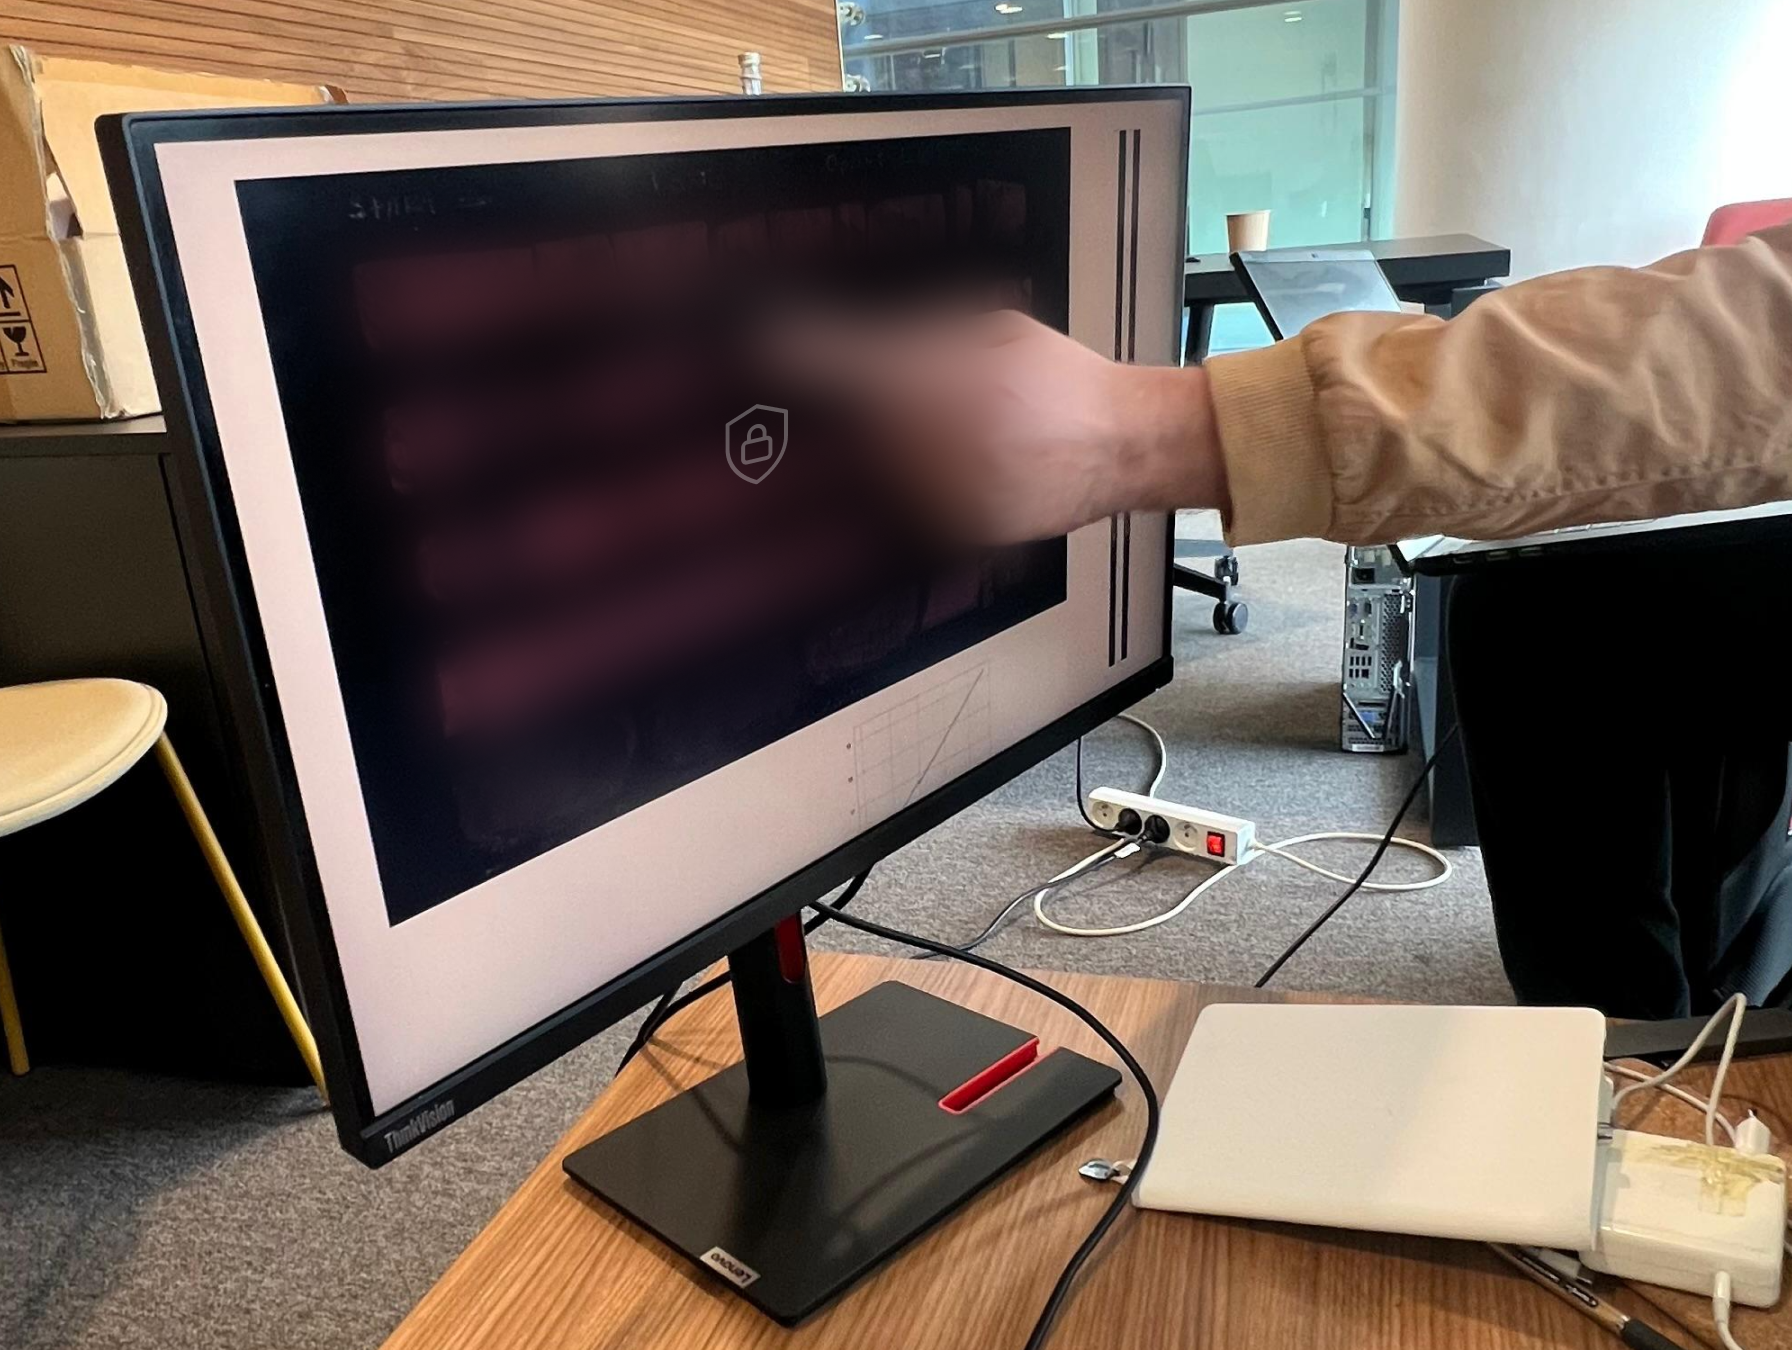
Early research became more productive when I gave stakeholders something concrete to react to. My main approach therefore was using "assumptions-led-prototypes" as research tools. For every major flow, once I had enough domain understanding to form an initial direction (i.e., through deconstructing reports, operational analysis, and internal discussions with domain experts), I created high-fidelity prototypes, then used it as a research tool to investigate gaps and test assumptions. When a workflow required deeper discussion, I led on-site UX workshops with stakeholders using interactive prototypes and printed screens. These sessions helped validate designs, uncover requirements, and gather insights for future modules. Some concepts were designed live to explore alternatives and clarify feedback. As a result, the platform evolved through continuous cycles of requirement interpretation, prototyping solutions, validating assumptions, iteration, and re-validation rather than through a traditional research-then-design process. Much of the project success came from these research and validation sessions.
Key Decisions & Tradeoffs
Designing around an existing mental model
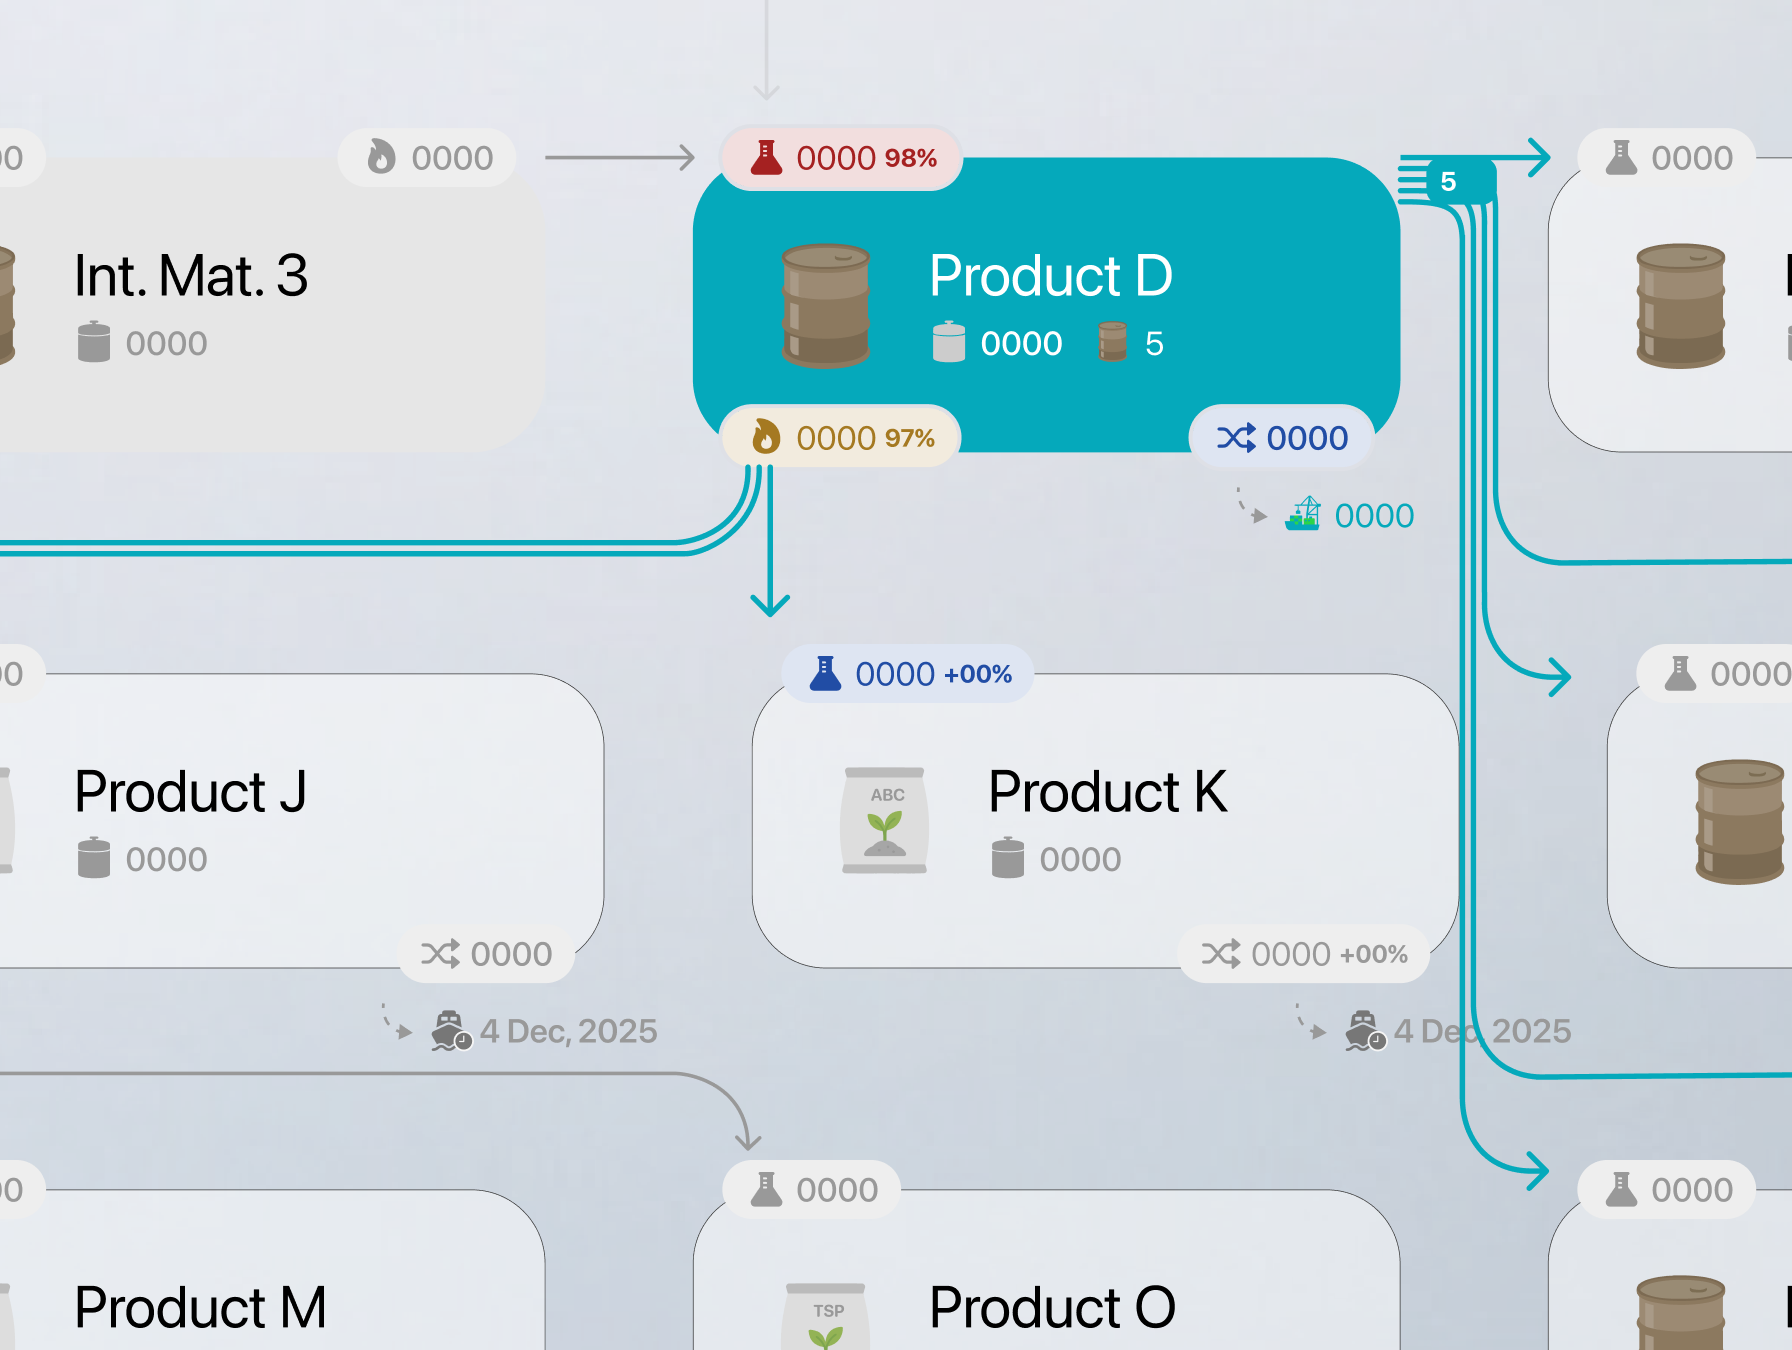
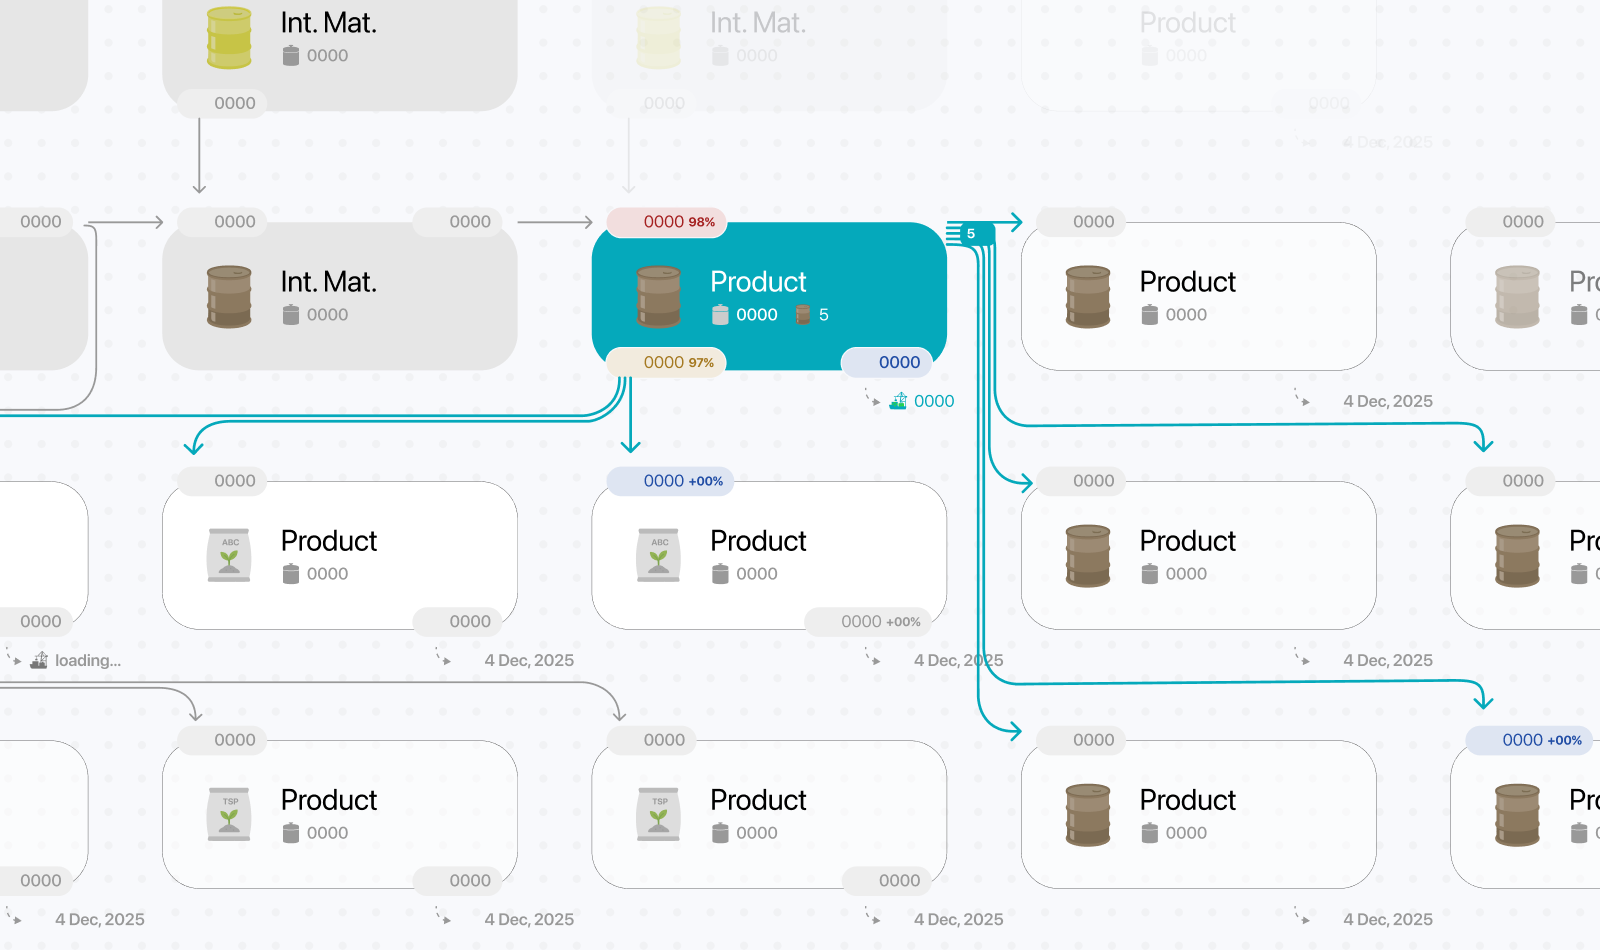
My initial direction adapted an operations visualizer from earlier work to the manufacturing context. Early feedback showed that the Executive Summary dashboard needed to come first, ahead of the detailed operational modules I had planned to prioritize. The early operational reporting concept later proved broadly appropriate when we returned to the detailed modules, requiring only minor adjustments. At this stage, however, the priority was to understand what stakeholders needed from the Executive Summary.
The breakthrough came when analysis of existing spreadsheets revealed a reporting logic that stakeholders knew well. Understanding that logic helped me shape the information architecture. The structure reflected the major phases of manufacturing operations and how executives evaluated performance. It became the foundation for the Executive Summary dashboard and influenced the platform’s performance hierarchy. The challenge then shifted to identifying which parts reflected genuine decision-making needs and which were artifacts of Excel and reporting constraints.
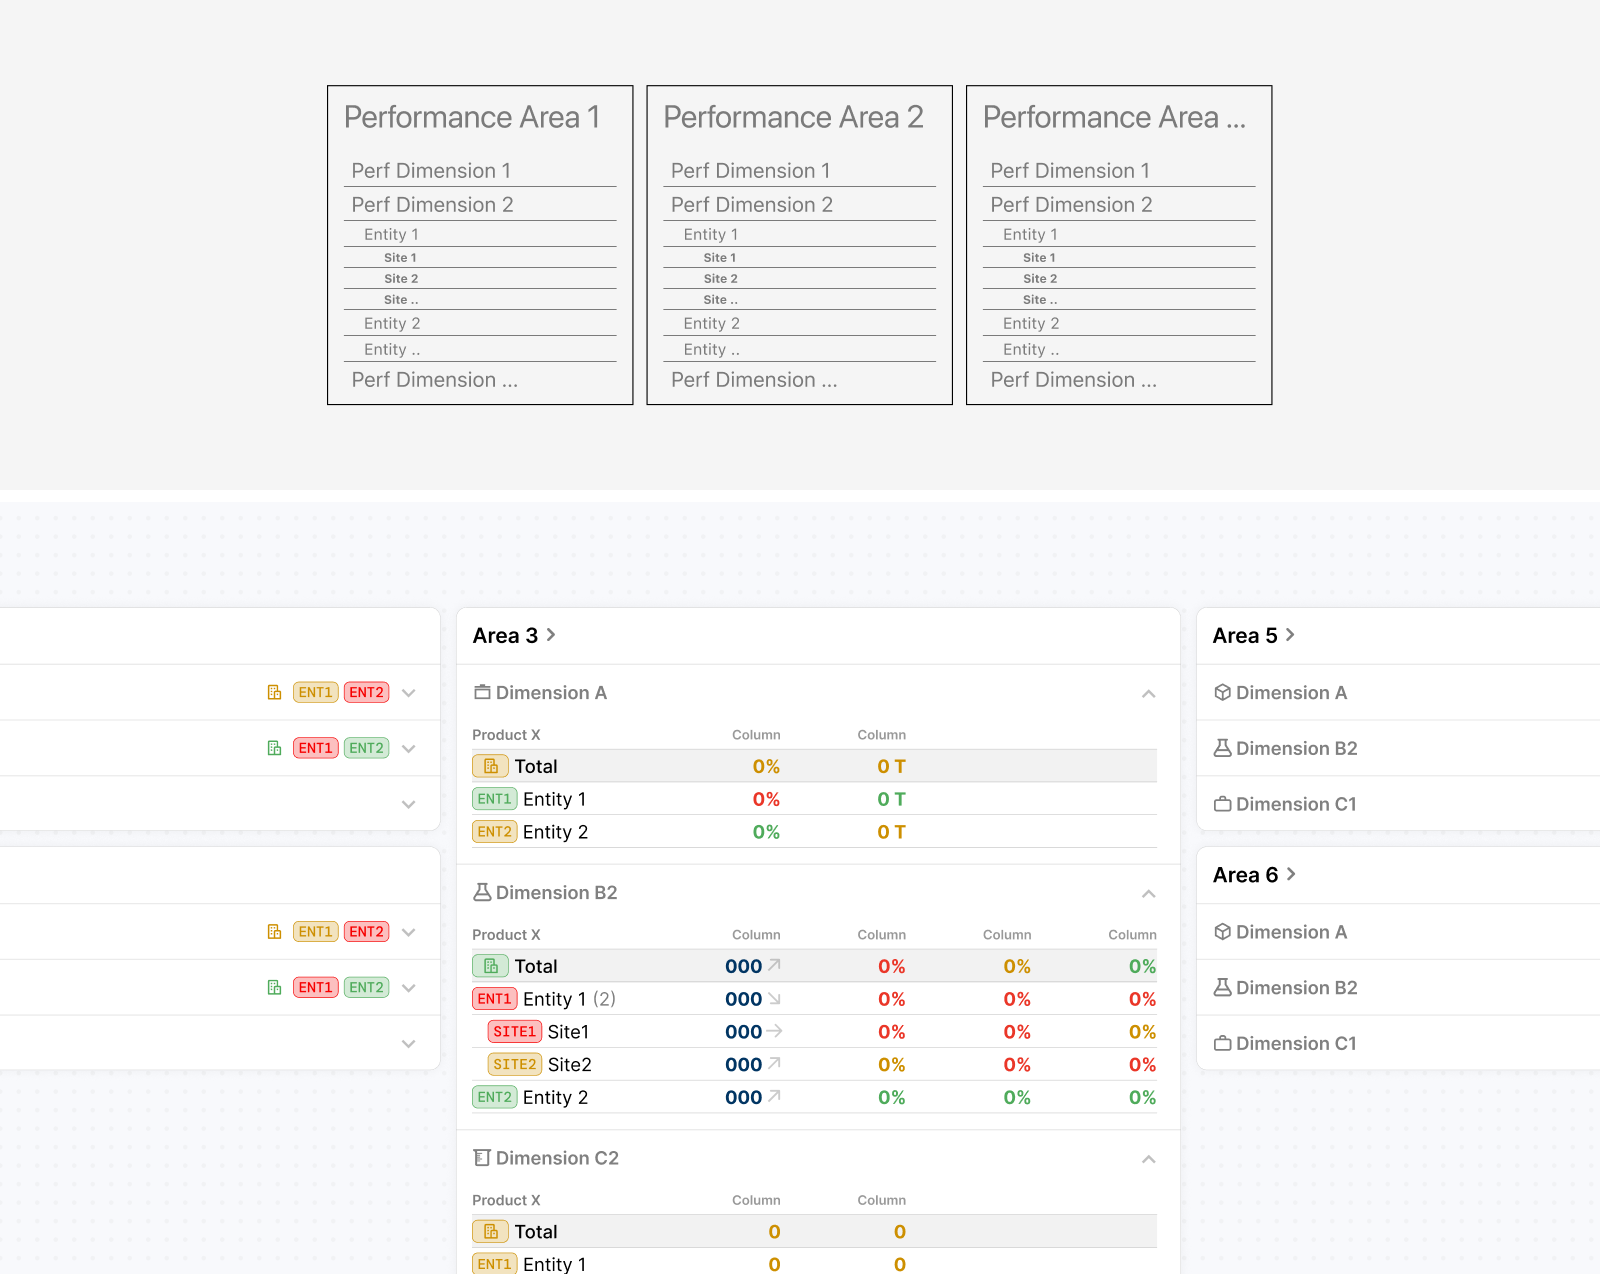
Translating this structure into the dashboard also revealed opportunities to reuse a small set of patterns and components which helped maintain consistency for users and made implementation more manageable despite the amount of information involved. Some secondary details and supporting content still required negotiation later in the project. Having worked with the same development team on previous large-scale platforms, I already had a good understanding of our technical constraints, delivery capacity, and implementation challenges. This made it easier to distinguish between improvements that were critical to the user experience and those that could be simplified or deferred to keep the project moving within its timeline.
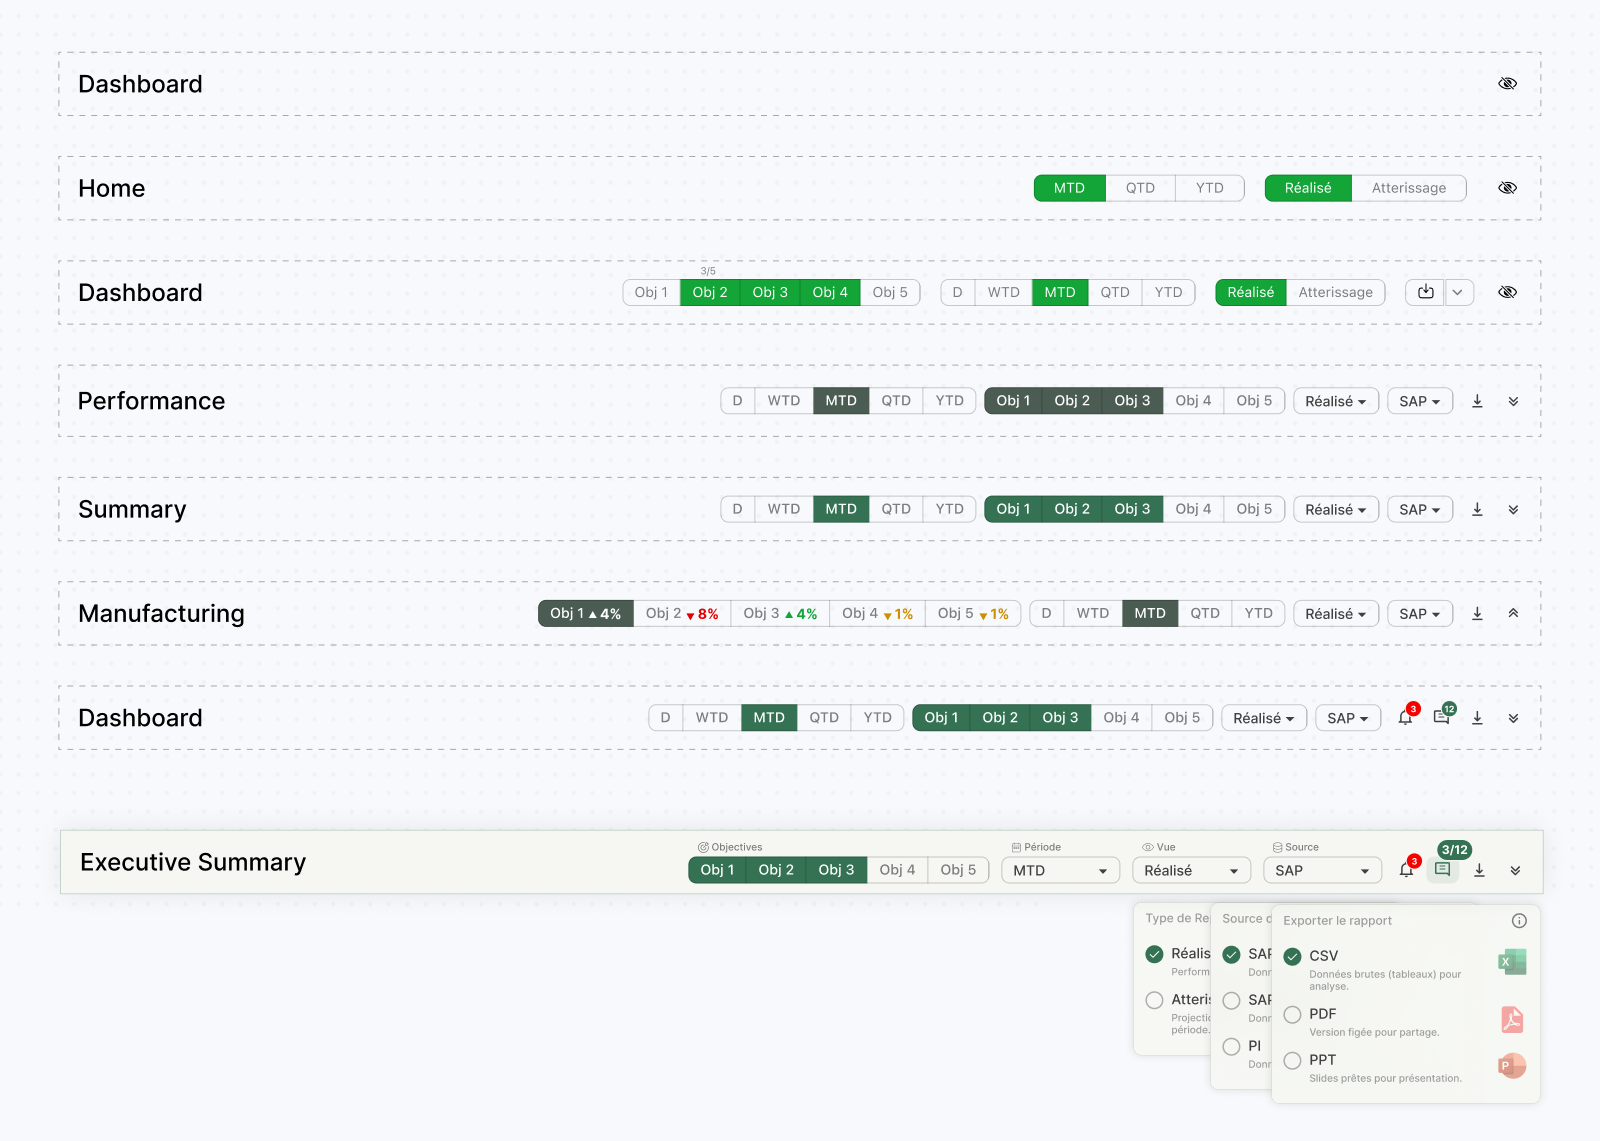
Many dashboard details went through several rounds of iteration, including later in the project as new requirements emerged. The toolbar shown below is one example: its controls evolved to support different benchmarks, reporting periods, views, and data sources, alongside comments, notifications, and export options. As these needs became clearer, I revisited how the controls were grouped, labeled, and displayed to keep the growing set of options understandable without overwhelming the dashboard.
Balancing quick assessment with deeper analysis
The Executive Summary dashboard had to support a specific decision model: first determine whether each phase of the manufacturing value chain was performing correctly, then understand the impact of any deviation, and finally trace its origin from high-level operational areas down to specific sites and plants. Achieving this within a single view was challenging given the scale of the operation and the amount of performance data involved.
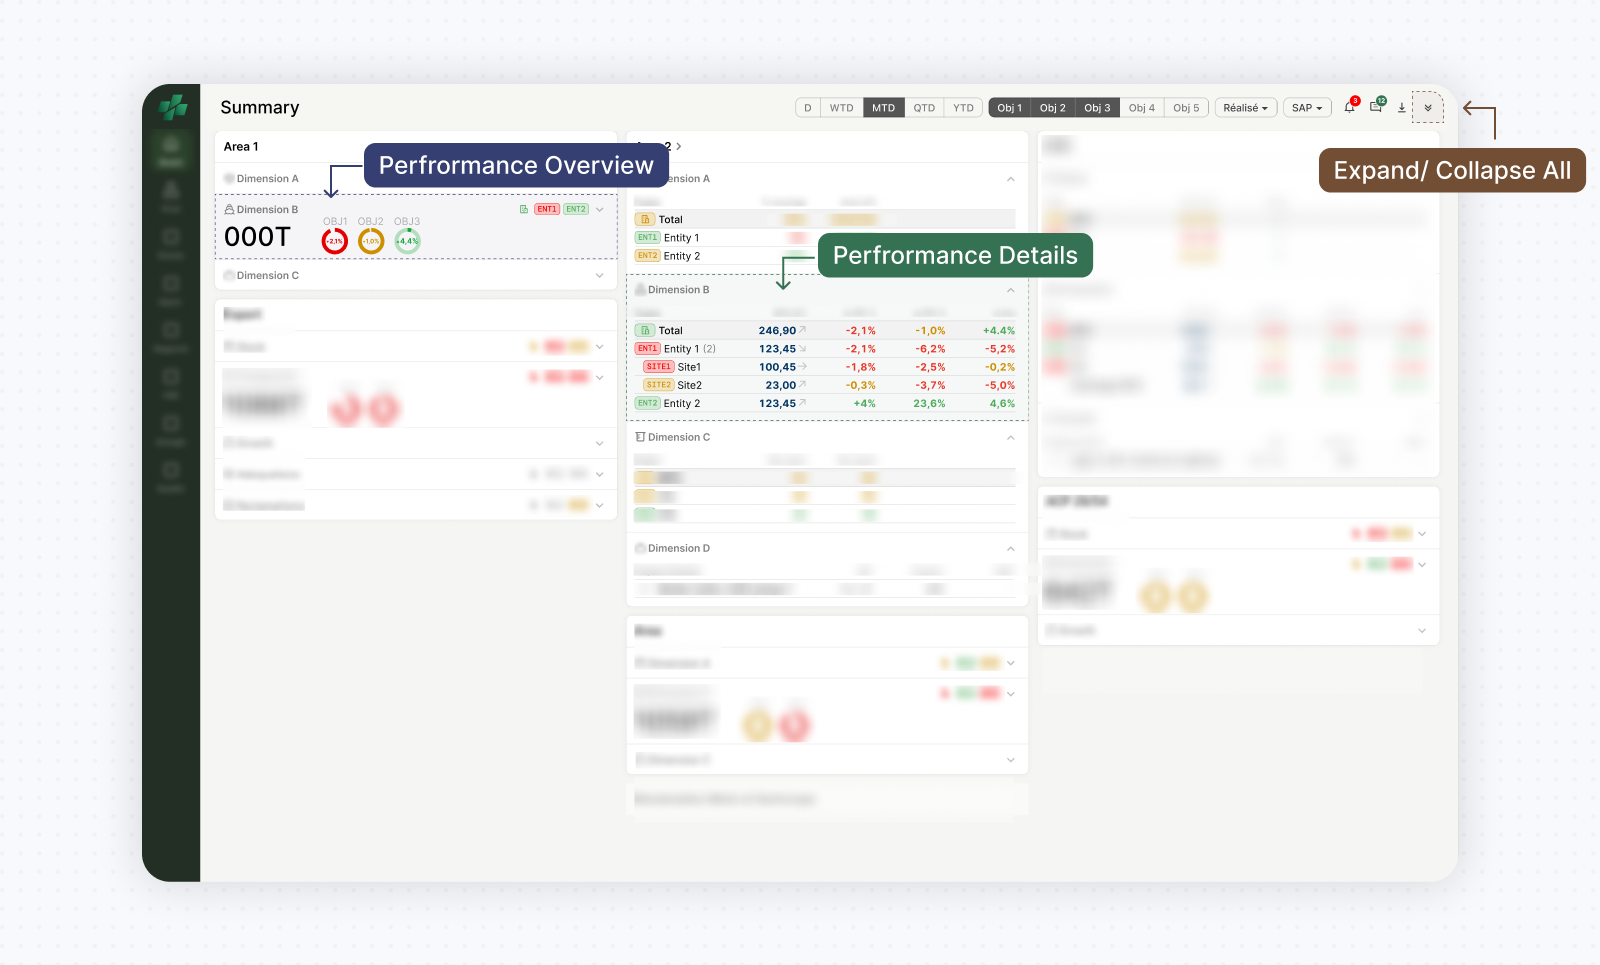
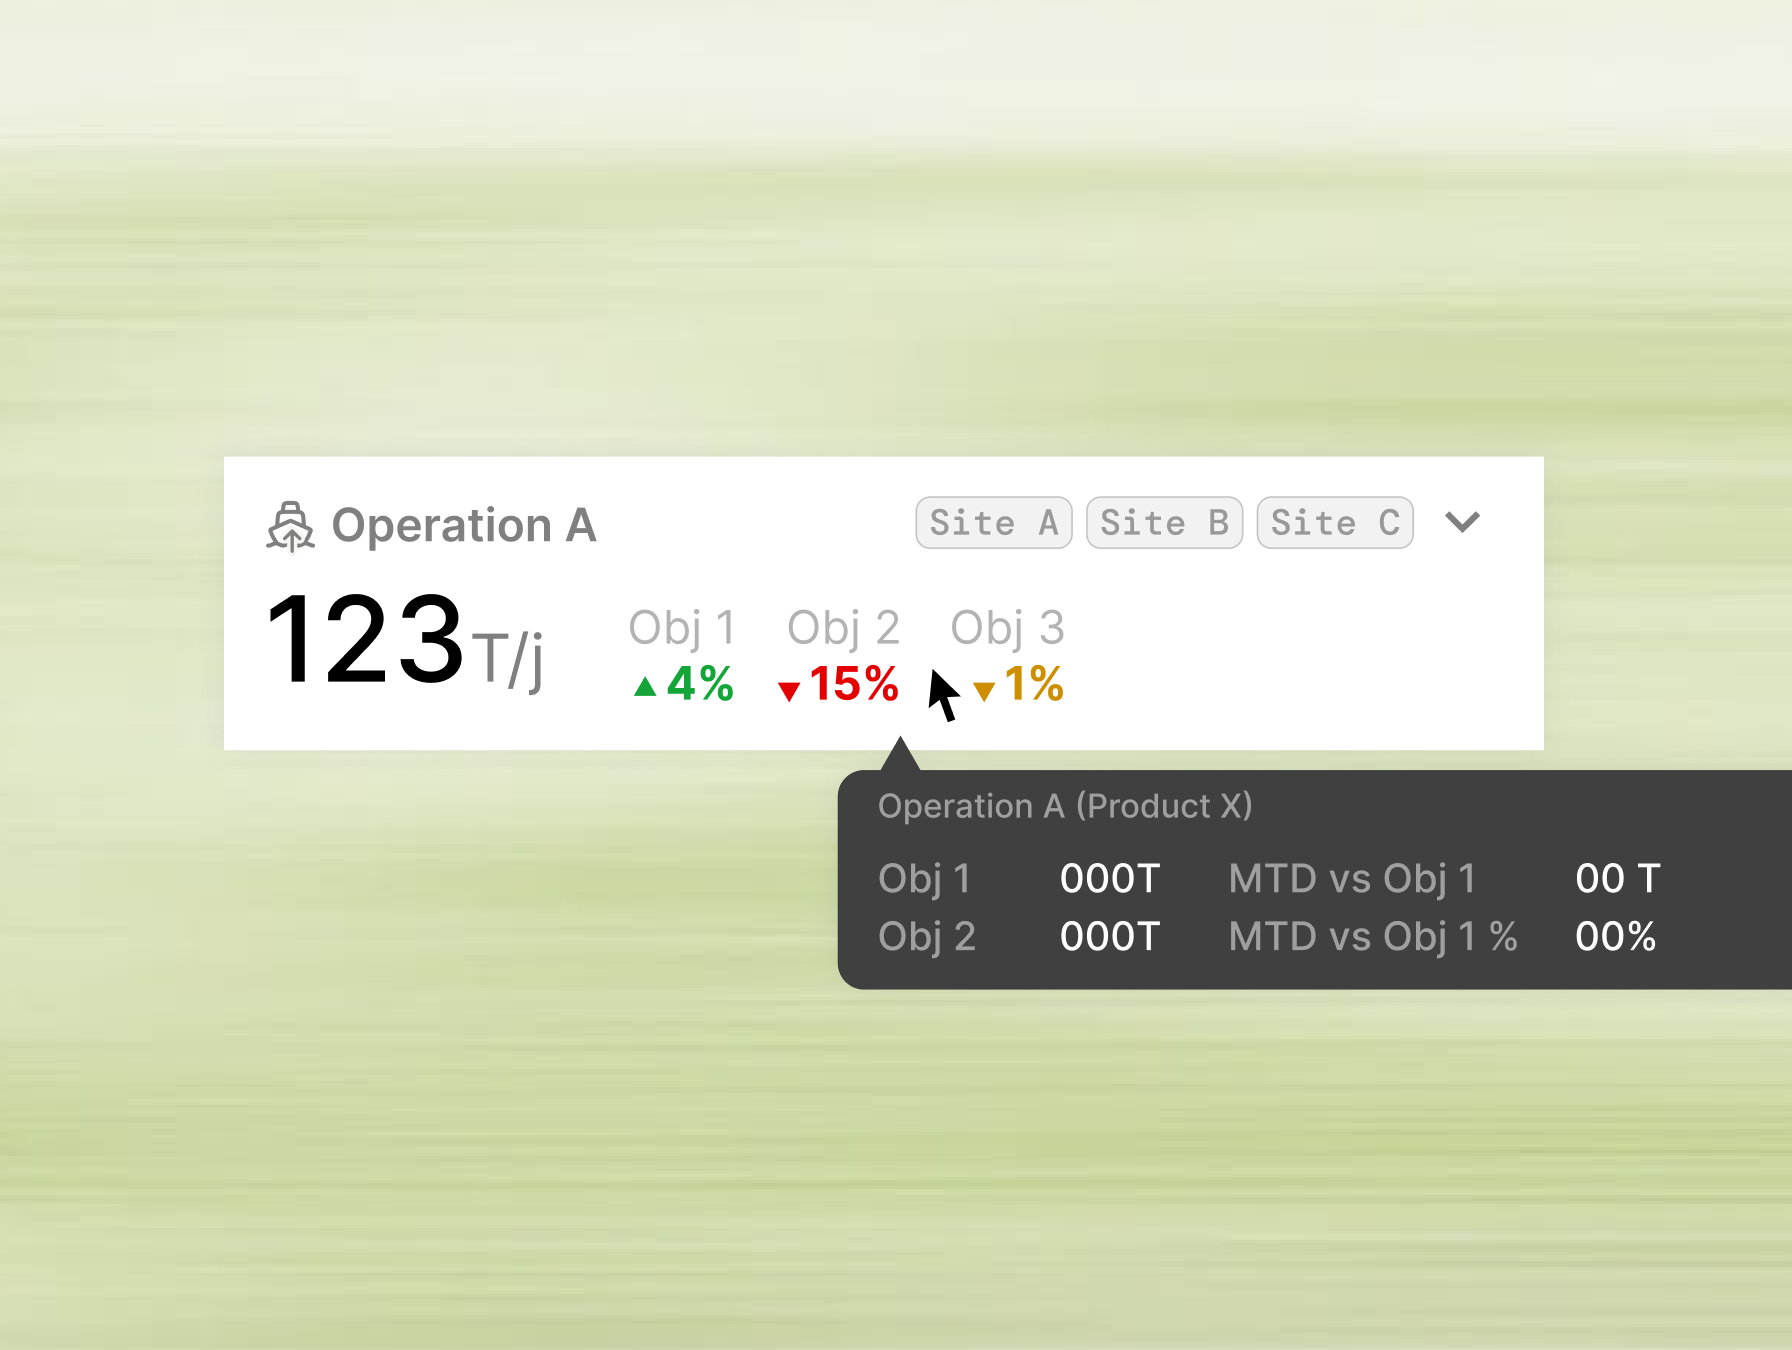
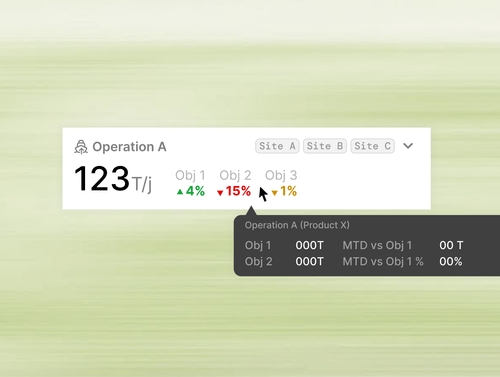
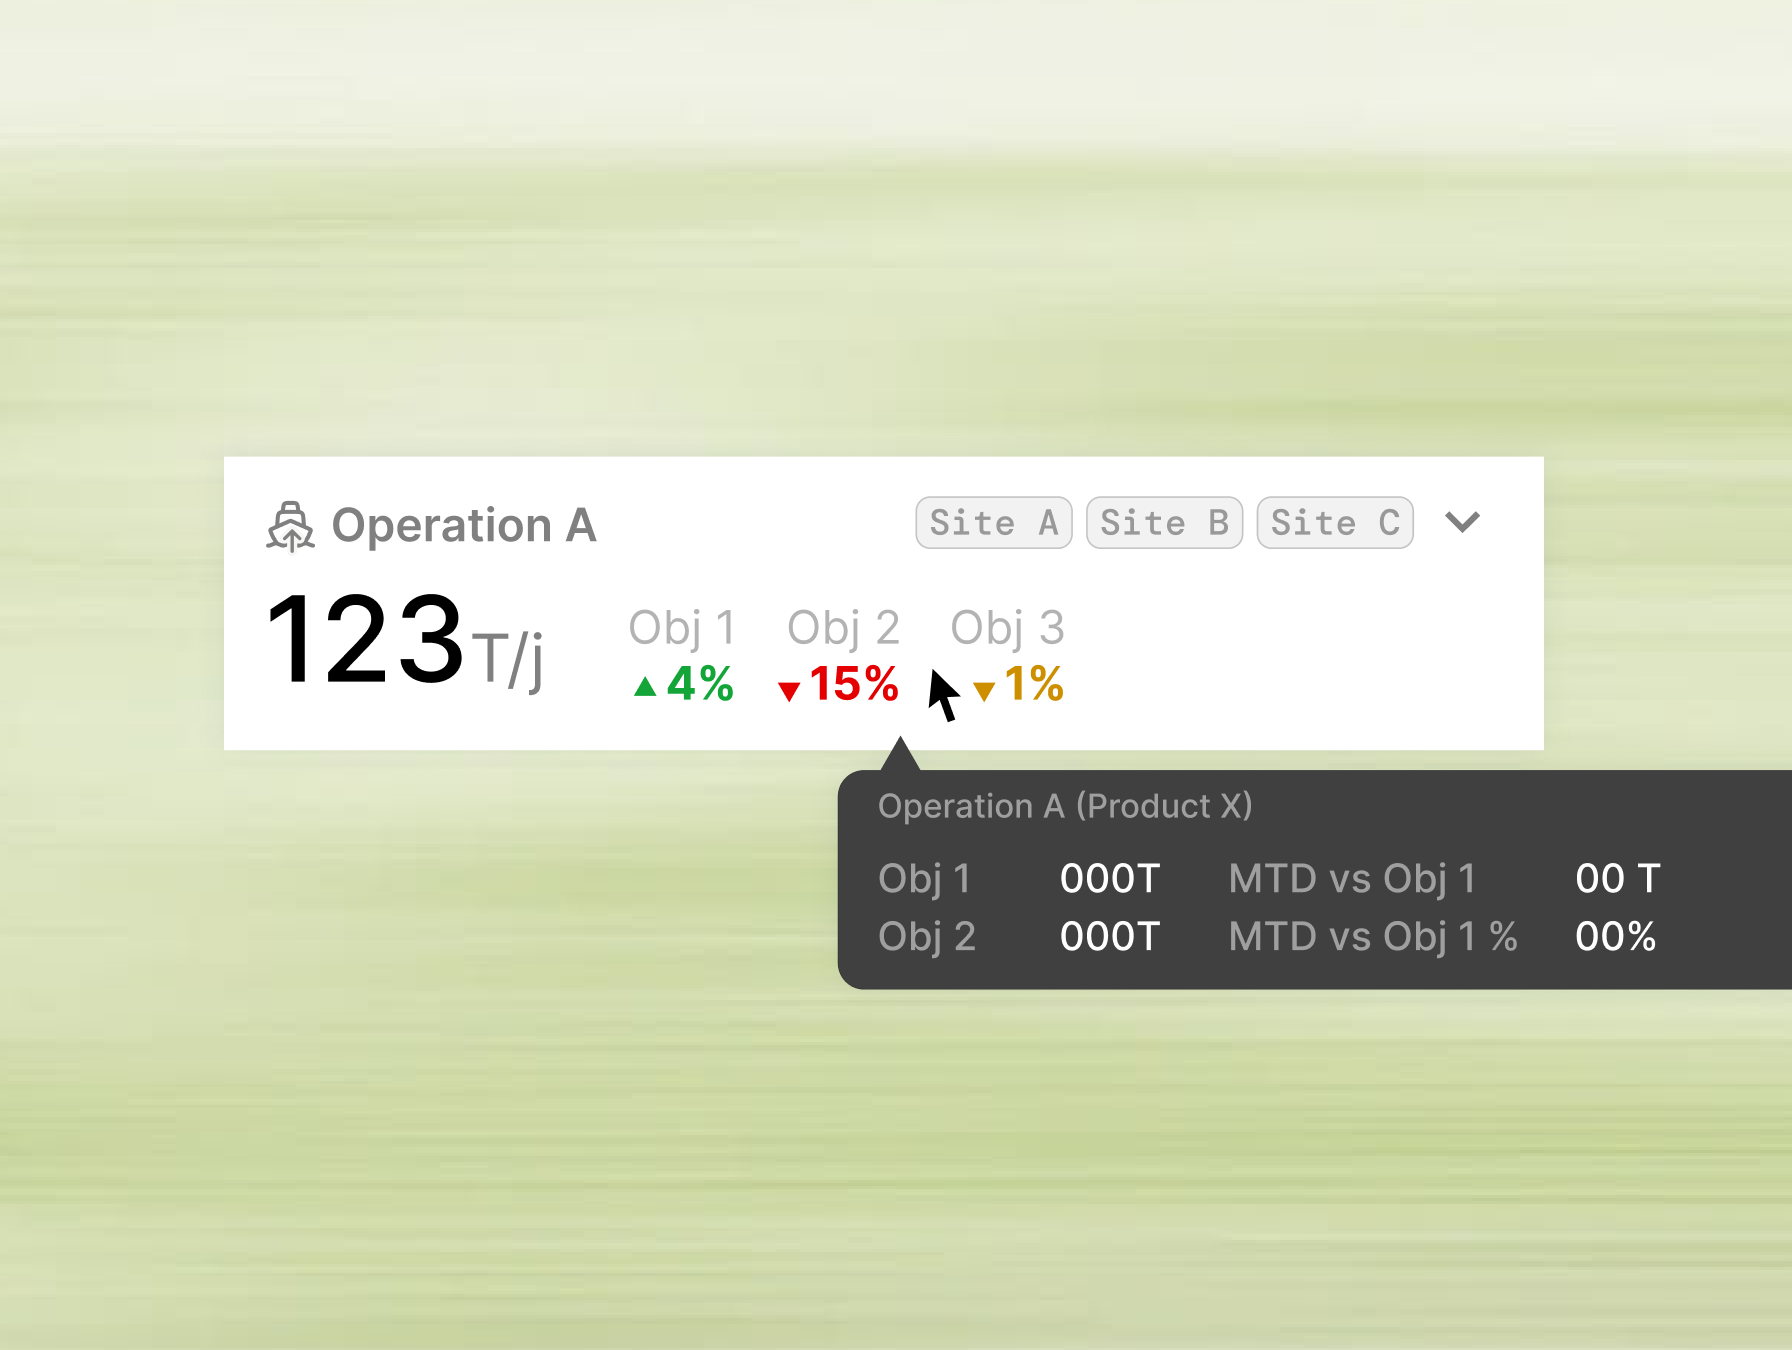
The solution was to separate overview and investigation into two layers of the same interface. Each value chain phase was represented through a consistent card structure containing expandable sections. In their collapsed state, sections displayed only the information required for rapid assessment: primary KPIs, semantically colored performance deltas, small trend indicators, and site-level deviation tags. Expanding a section progressively revealed the operational breakdown behind those deviations without requiring navigation away from the dashboard. This pattern went through several iterations. Early versions were too condensed and required excessive expansion, while later versions exposed too much information and weakened the summary view. he balance gradually emerged through a few rounds of iteration: enough information to support instant deviation detection and impact assessment, while preserving deeper investigation as an intentional action.
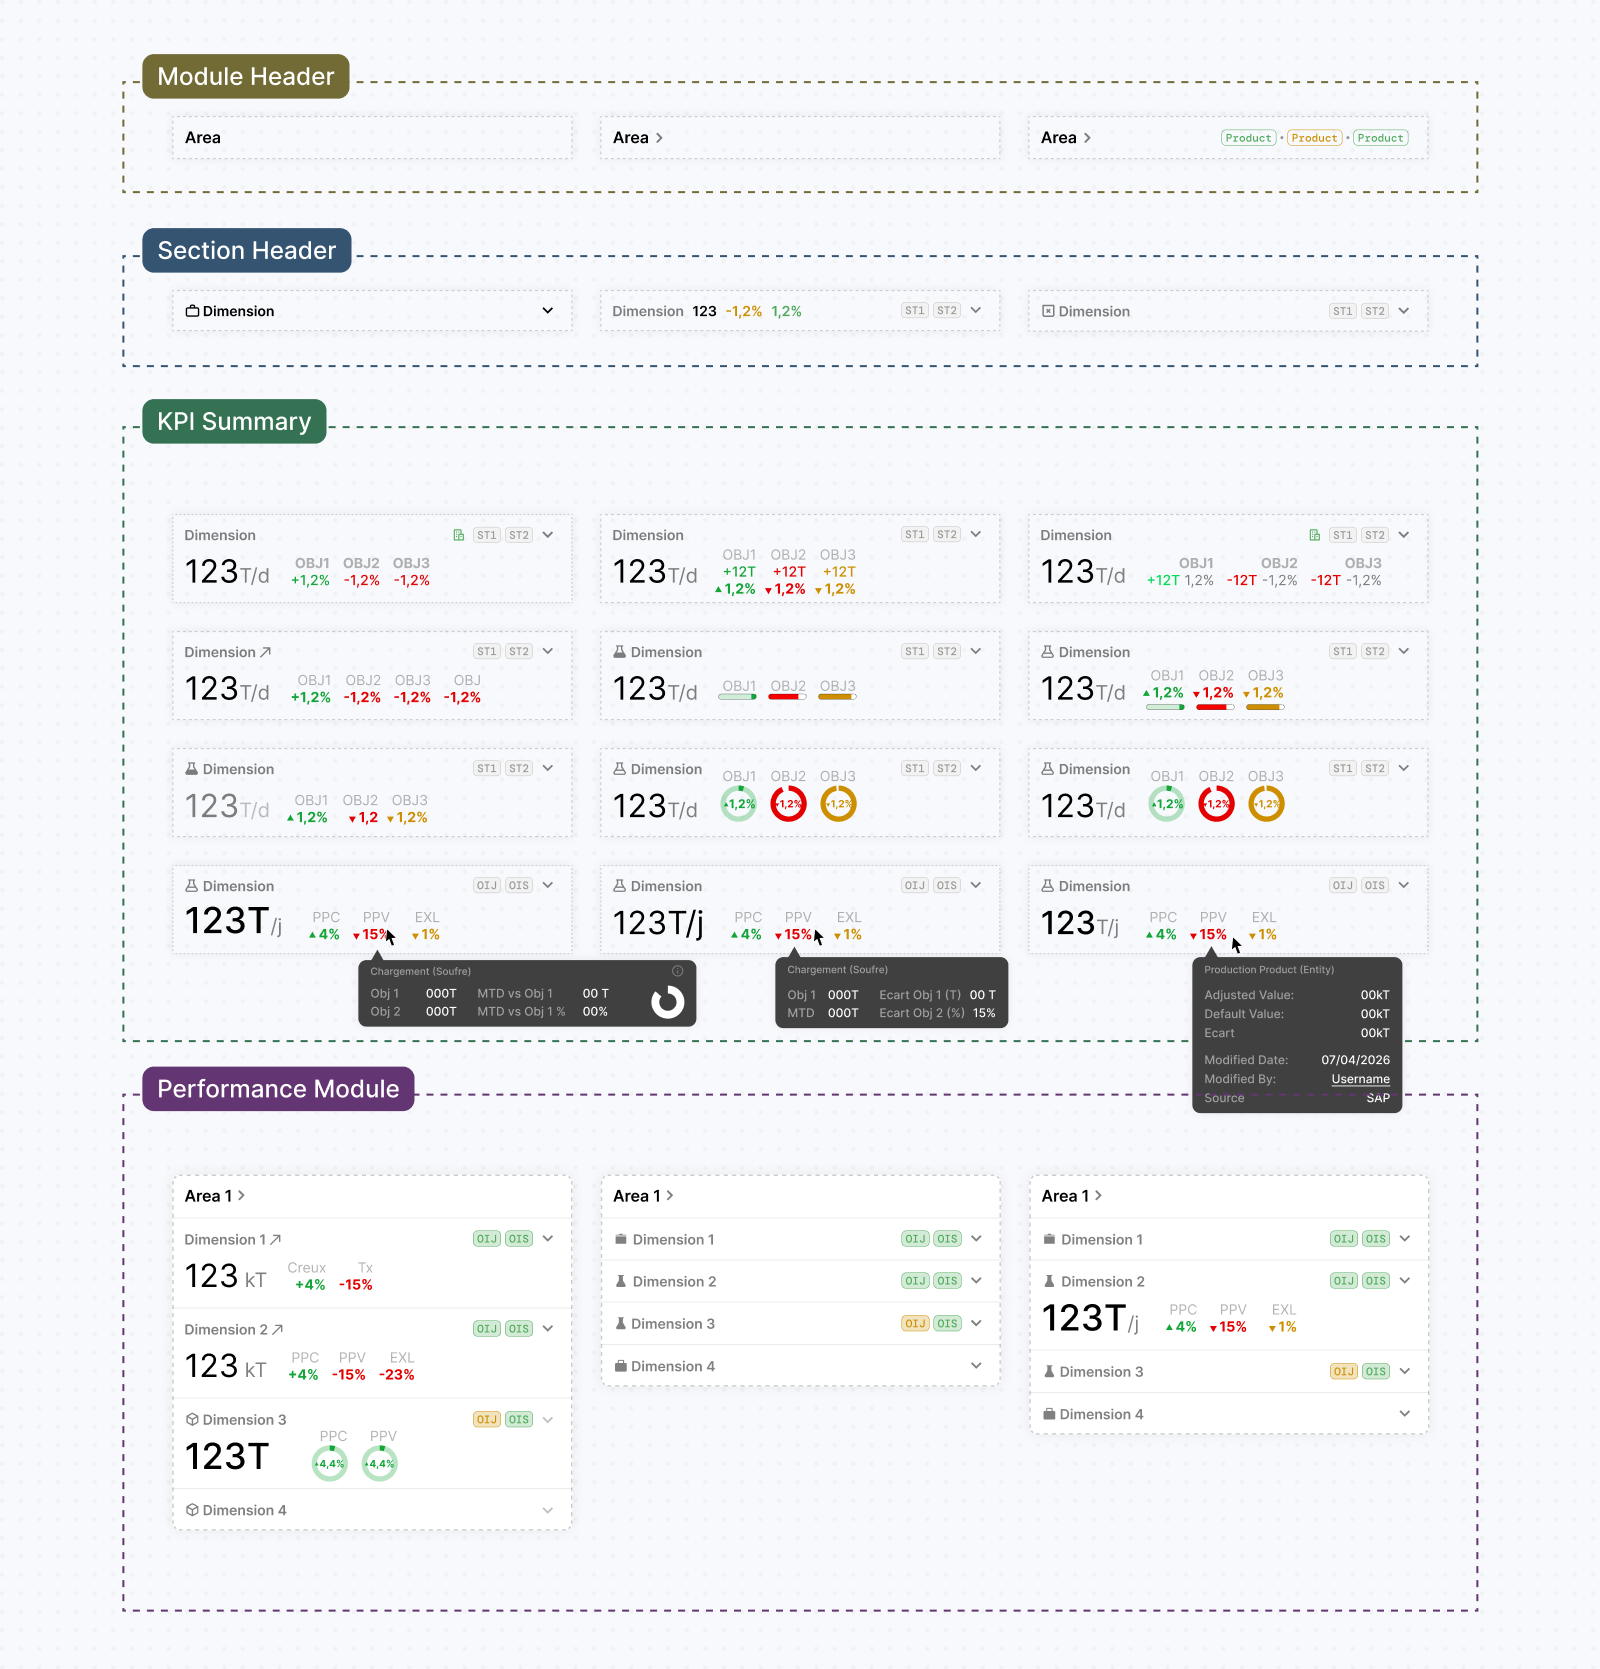
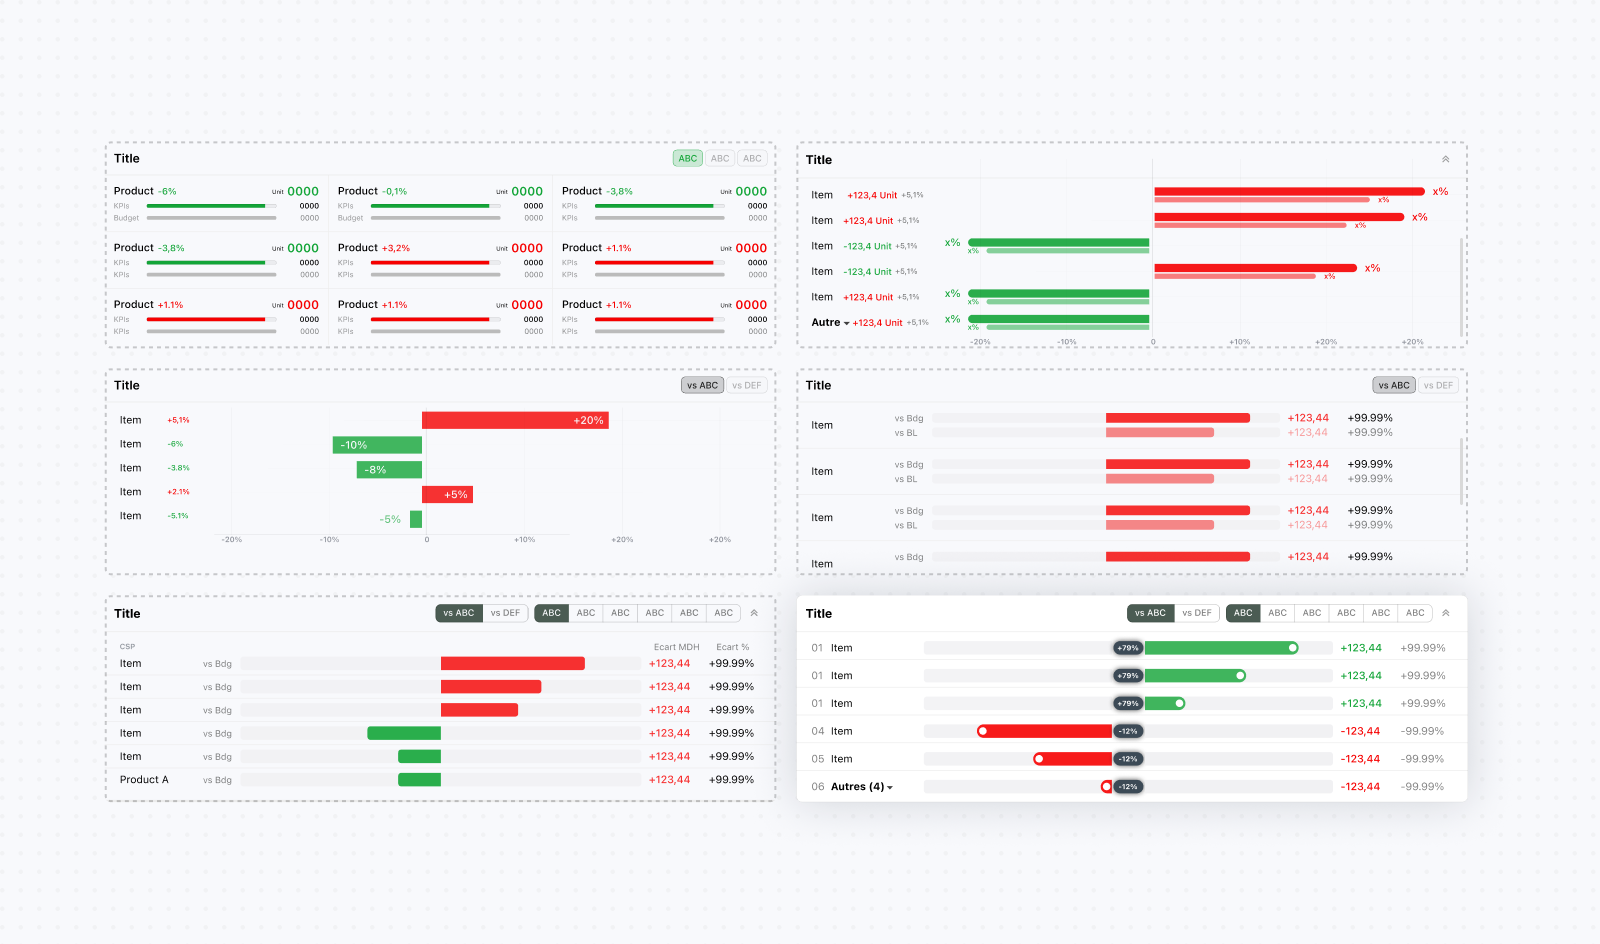
Within the expanded view, performance KPIs were represented through hierarchical tables that mirrored the manufacturing structure. Users could progressively move from high-level operational areas to sites and finally plants, allowing them to trace the source of a deviation without leaving the dashboard. To keep the view manageable, only the most impactful contributors were shown at the lowest level by default, while still allowing further exploration when needed. Each row displayed multiple performance dimensions simultaneously, supported by global controls that allowed users to switch benchmarks and reporting perspectives across the entire dashboard.
These tables later became more than reporting components. Site rows evolved into navigation entry points leading directly to detailed reporting pages and contextual discussions related to that site's performance. Because tables became one of the platform's most frequently used interaction patterns, their design received significant attention. Numerical values were monospaced for easier comparison, column widths were designed around real operational edge cases, and top-level summary rows were highlighted with a subtle grey background to improve scanability across dense datasets. I intentionally pushed back against zebra striping because it introduced visual noise and conflicted with hierarchy and state indicators. Instead, hierarchy, spacing, hover states, and semantic highlighting were used to guide attention.
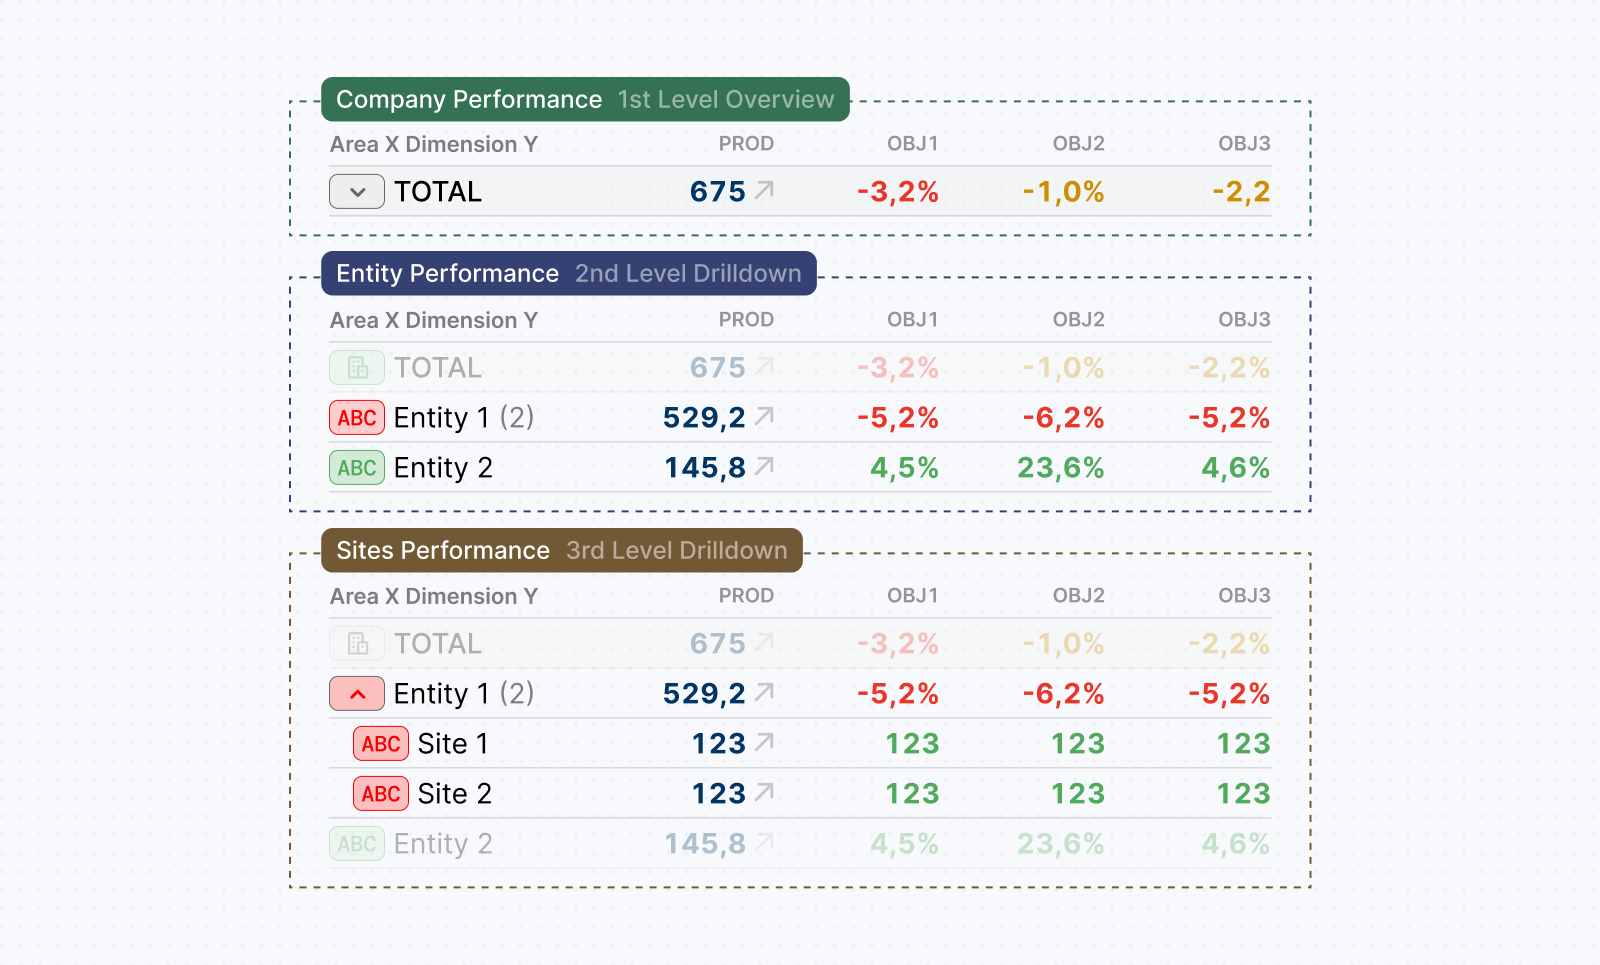
During testing and subsequent client presentations, participants reported being able to assess perforamnce across the manufacturing value chain in just a few seconds. Familiar mental models, consistent structures, clear visual hierarchy, and progresive disclosure helped them identify the most significant deviations and trace their impact through sites and operational entities, all from a single screen.
Designing communication around performance
The executive summary dashboard helped identify deviations but did not explain them. Executives also needed to understand why a particular site or product had underperformed or overperformed, so we needed a new workflow to allow this. Originally, operational teams collected these explanations in separate Excel and PPT files to document events such as line stops, maintenance, experiments, or improvements alongside the relevant performance figures. Bringing this context into the platform became another important design challenge. We initially referred to this feature as "Comments".
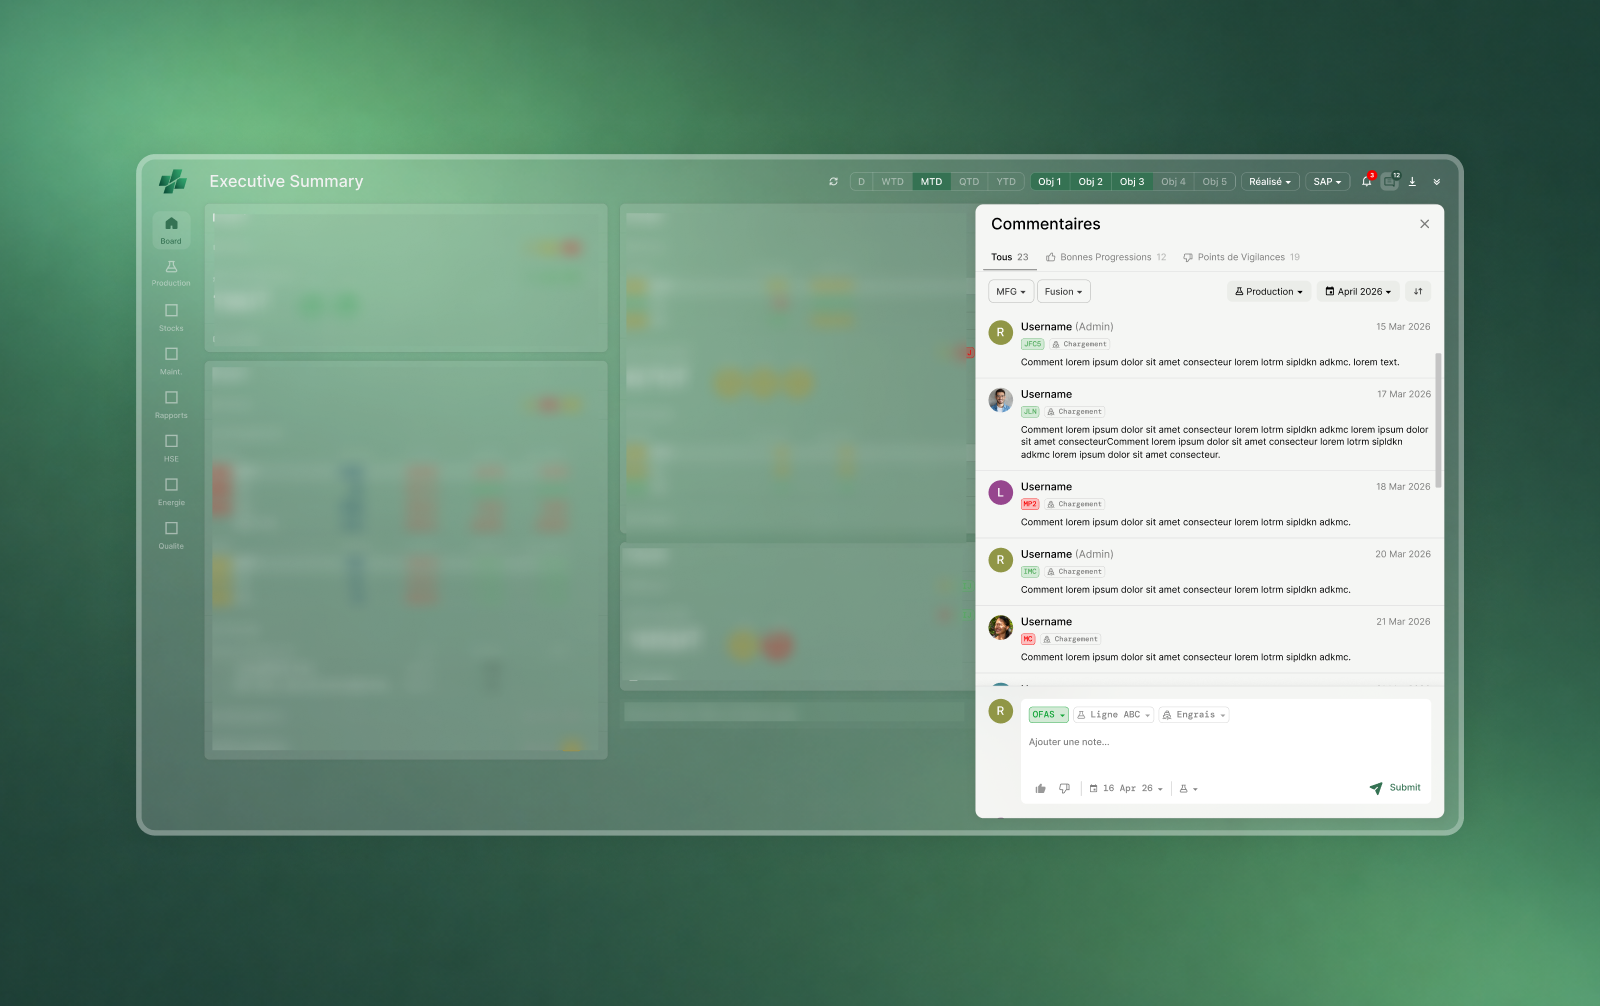
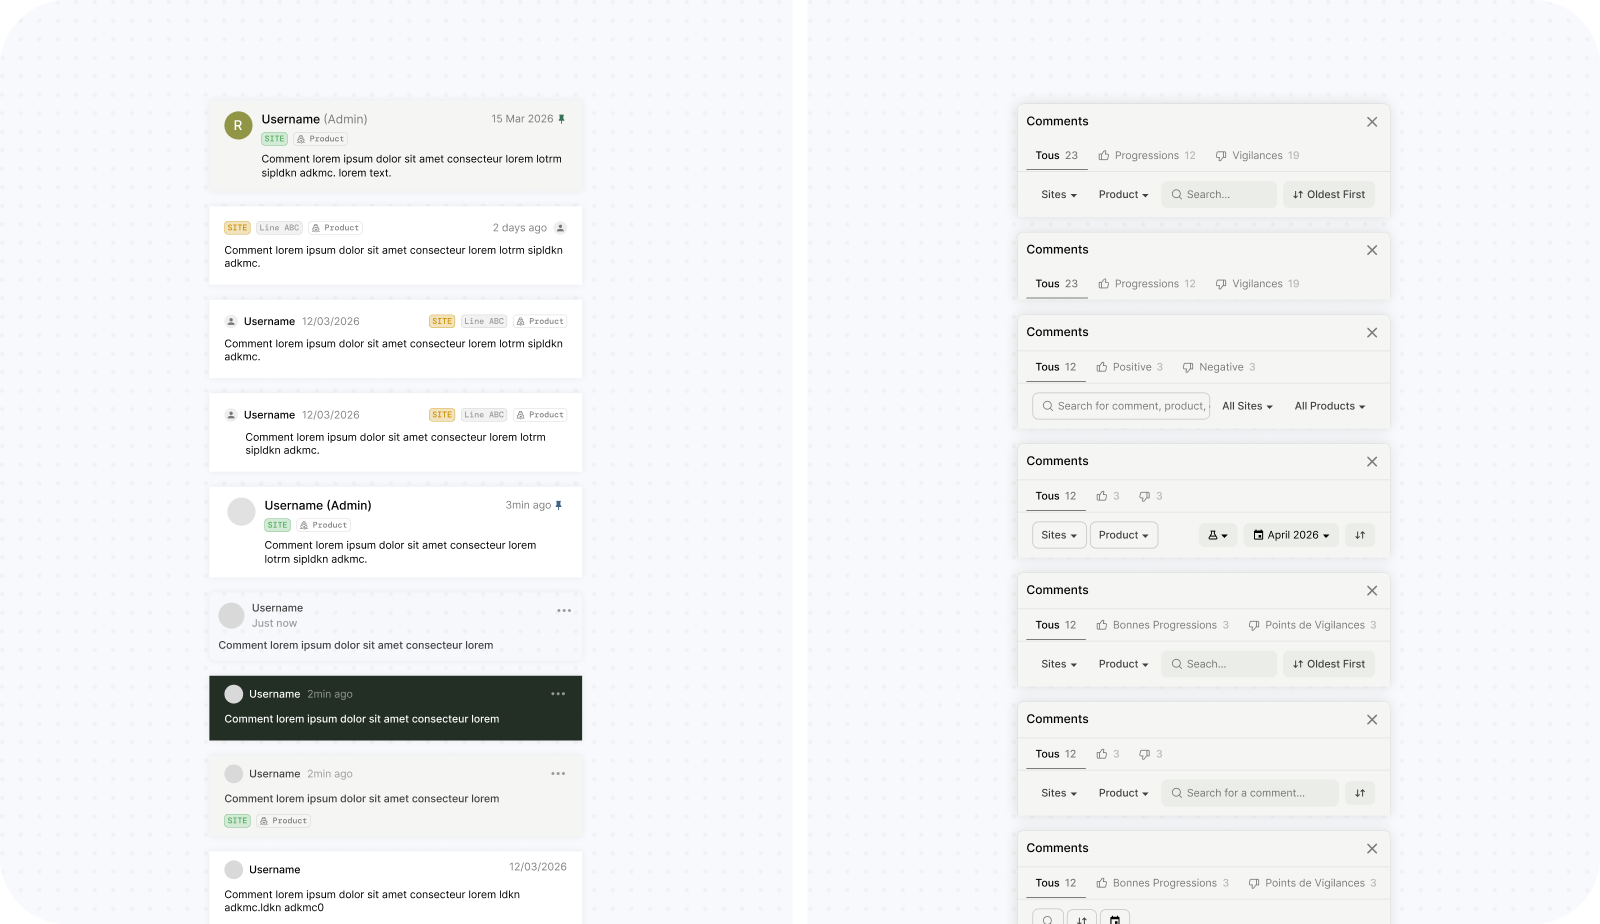
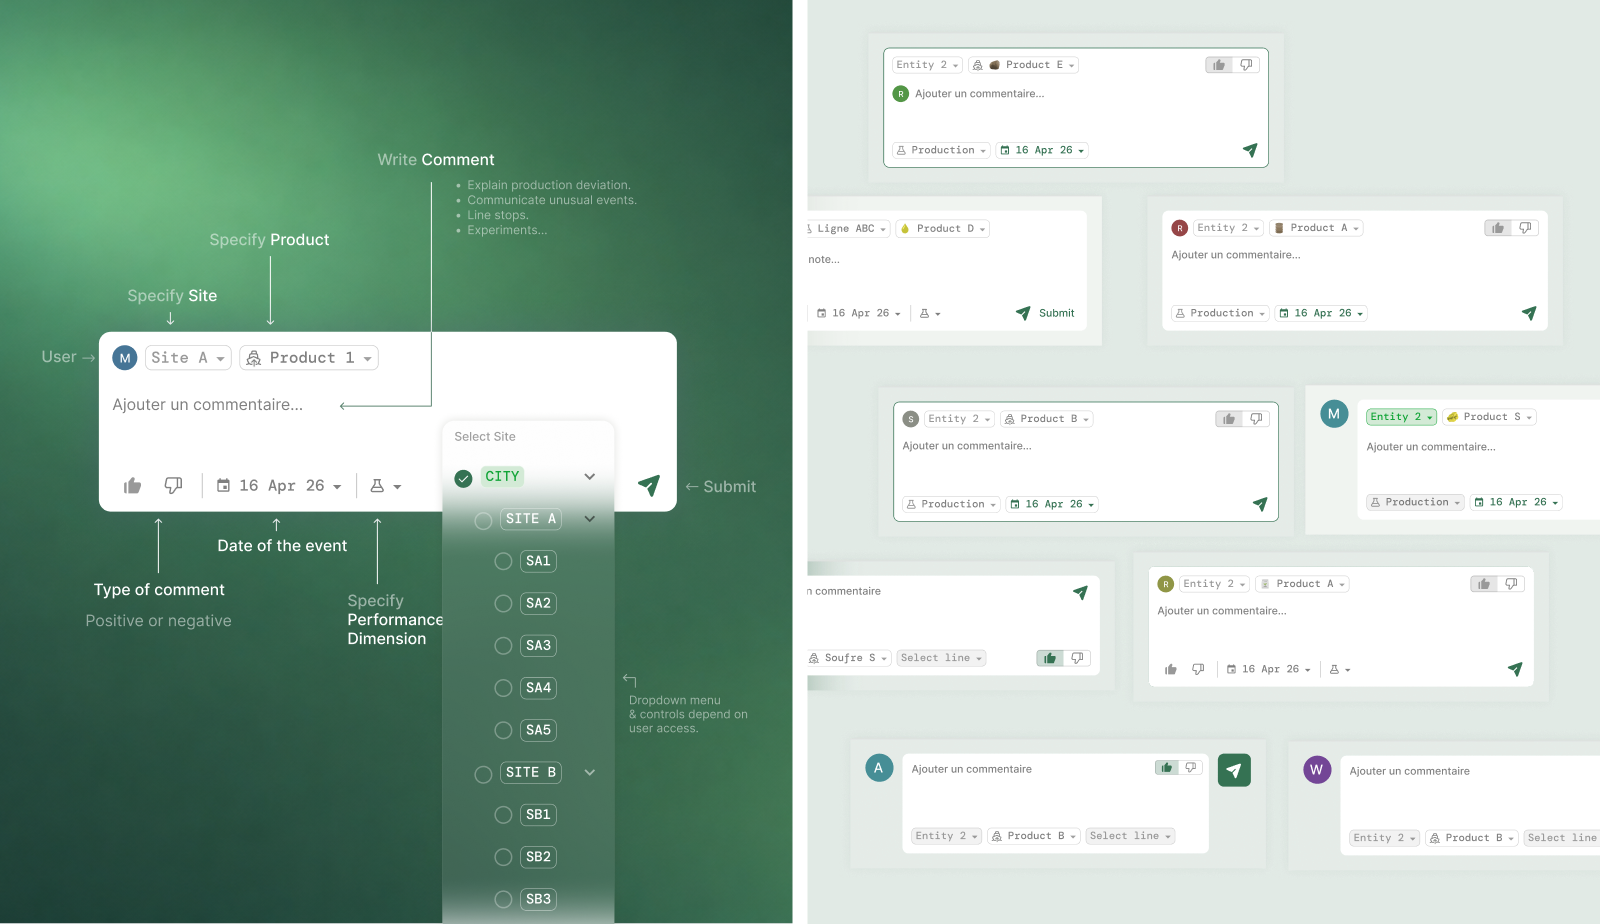
My first direction used a notification-style feed accessible from the dashboard, with each entry showing its author, site, product, and operation. Users with the appropriate access could submit an explanation through a composer, specify its context, and categorize it as positive or negative. Stakeholders responded well to accessing these explanations from the dashboard, but some felt the composer was not an effecient input mechanism. On top of this, further requirements sessions revealed that the entries were not independent messages. A single problem could have several action plans, each with its own status and impact. Users needed to document what had happened, what they were doing about it, and how much of the lost production had been recovered. For example, an issue could cause a loss of ten tons, while separate actions recovered different portions of that loss. A flat comment could describe this, but made the relationship between the cause, actions, and their individual contributions difficult to review. The workflow needed to make those relationships explicit.
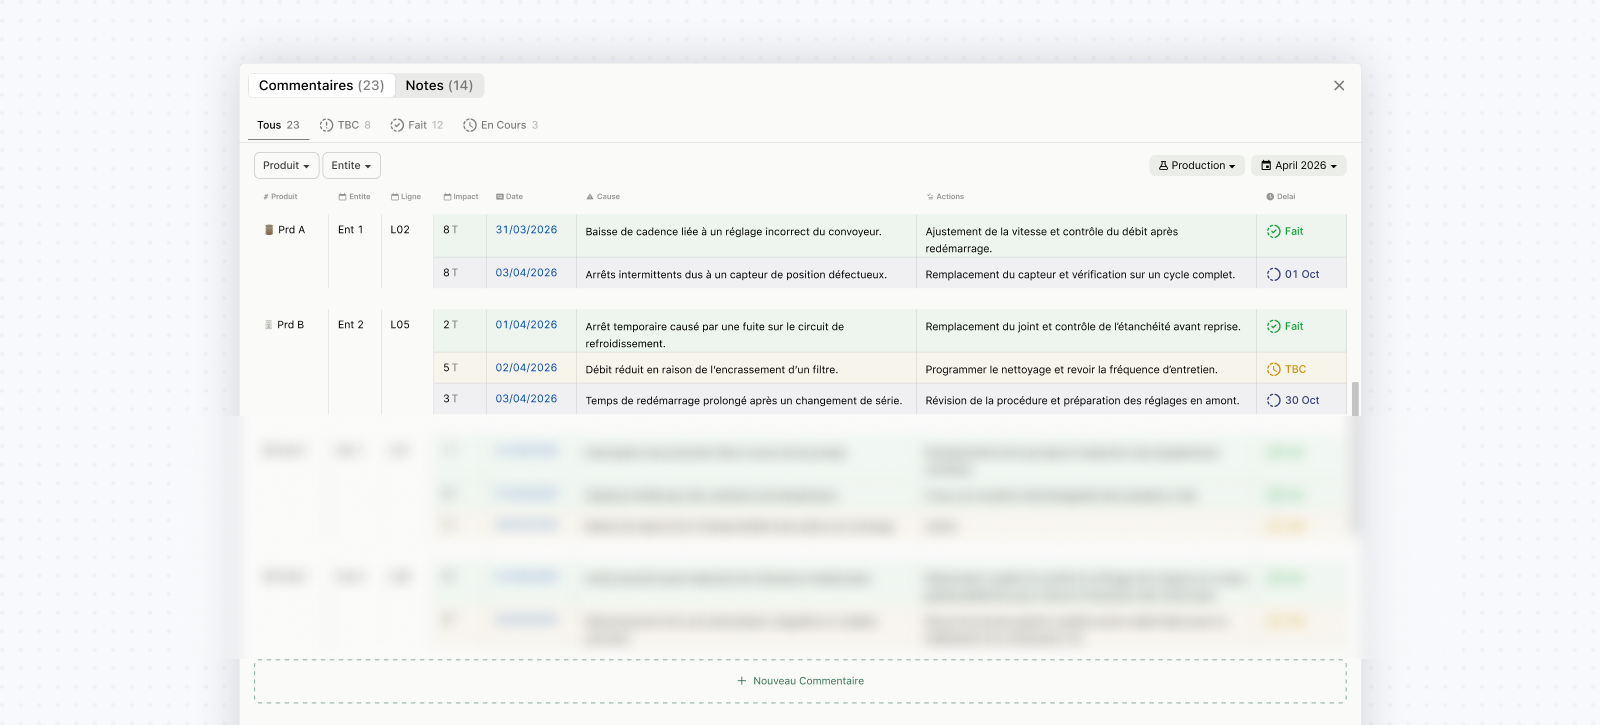
I moved towards a table that brought the operational context, date, impact in tons, cause, action plans, and action status into a shared view. Users could filter entries by product, entity, operation, or date. Creating an entry also became a structured form: users with the appropriate access could specify the context and add multiple action plans with their associated details. Alongside this, we explored a separate notes flow for another group of users who needed to add observations or comment on action plans without documenting a cause or quantified impact. Keeping notes separate avoided forcing every contribution into the same reporting structure. The table and form required more explicit input than the original composer, but better supported how users documented and reviewed operational events. We also removed the search functionality explored in early versions because the volume of entries did not justify the additional scope, and contextual filters were sufficient for finding relevant records.
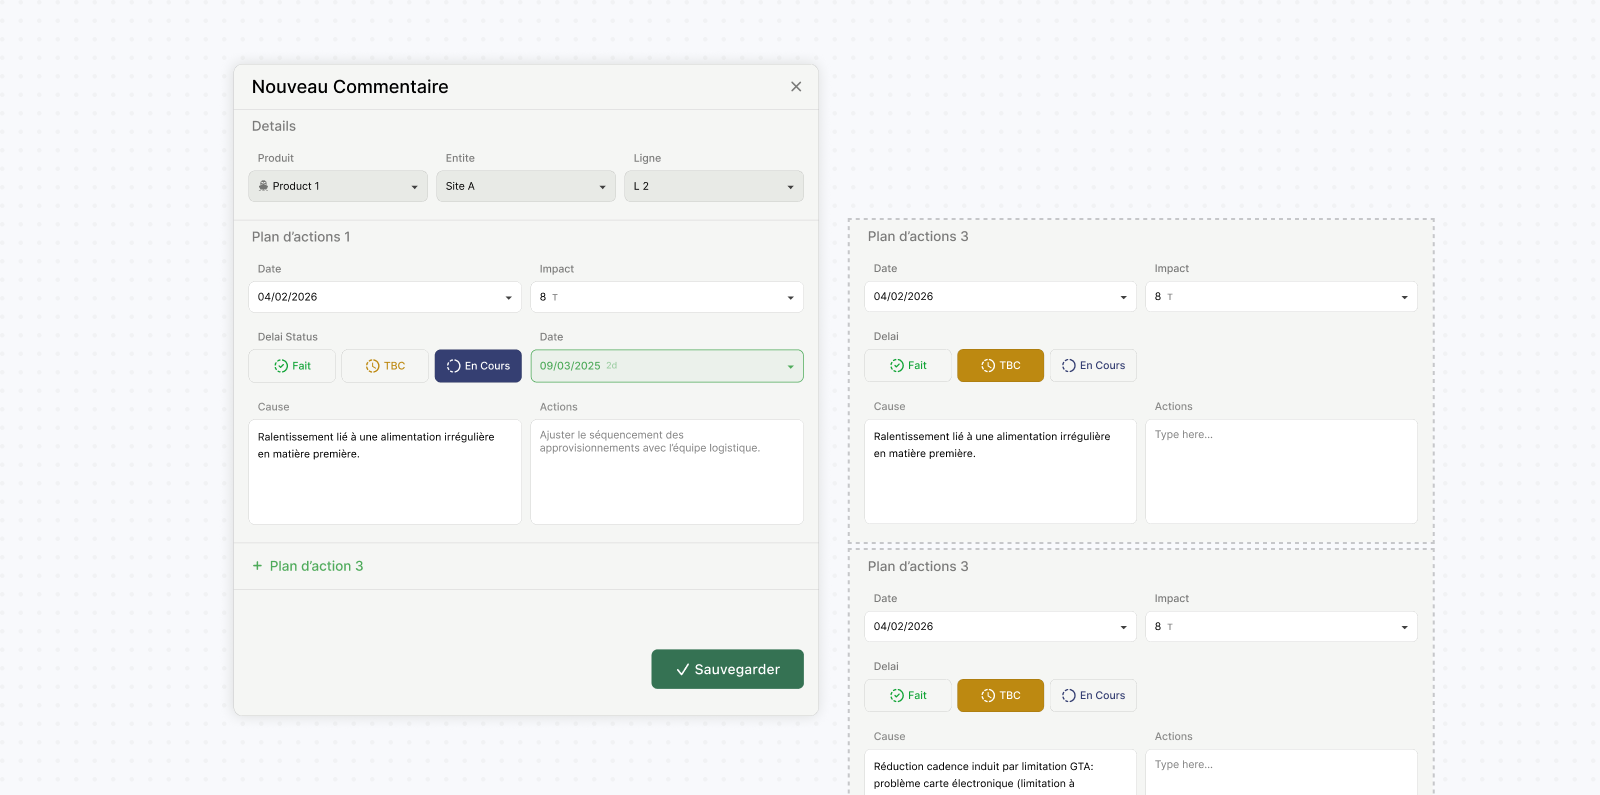
Moving to this structure also meant letting go of the composer I had spent considerable time refining. It was a reminder that a well-refined interaction can still be built around an incomplete understanding of the workflow.
Designing what "Professional" looks like
I was already familiar with designing for B2B environments, where efficiency, density, and clarity often matter more than the visual qualities associated with consumer UI. The users of this platform were accustomed to spreadsheets, enterprise systems, and operational reporting tools. The visual direction needed to feel familiar and precise while supporting clearer workflows and interactions.
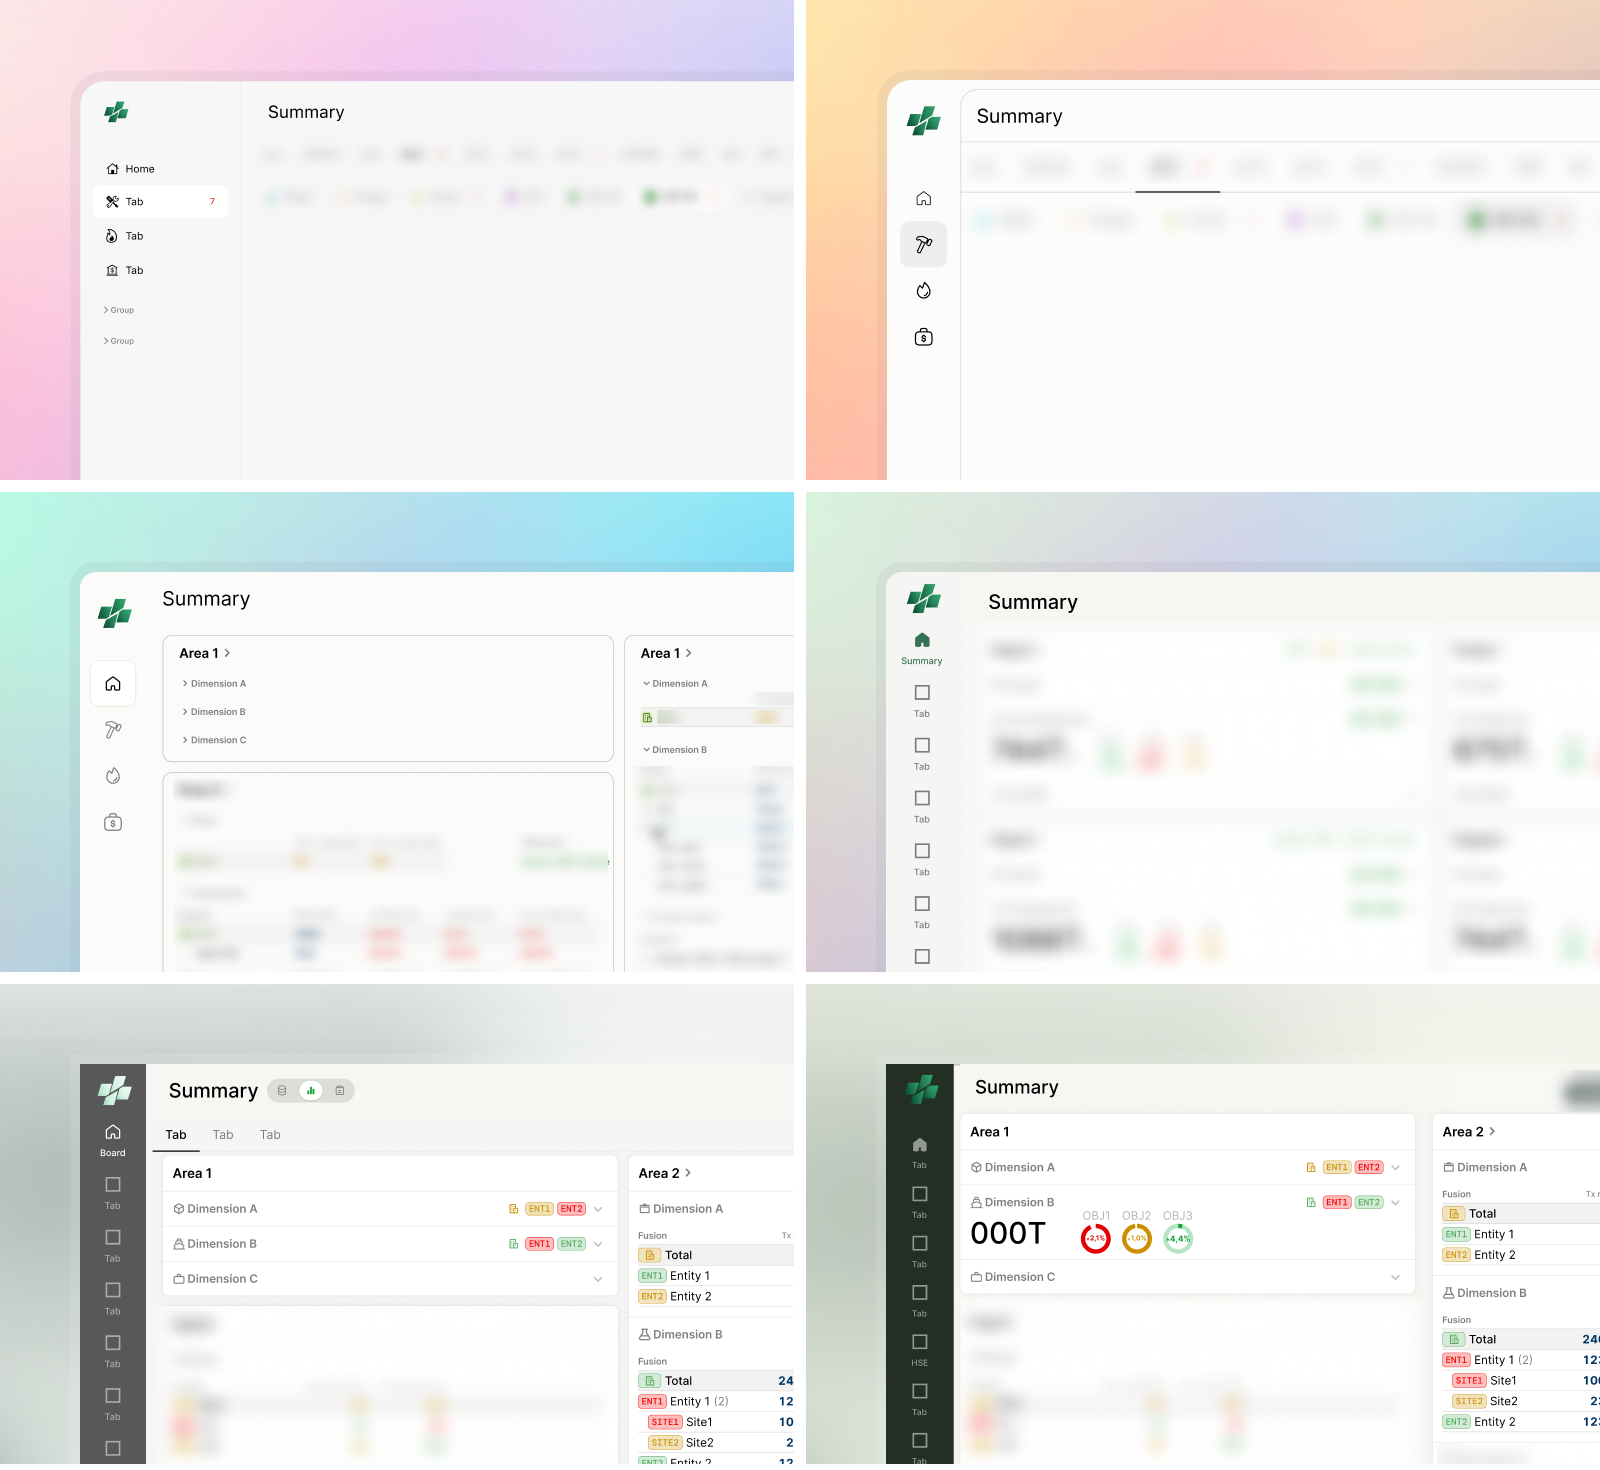
Stakeholders referenced reports and existing tools as examples to follow. Rather than copying their visual language, I focused on understanding the underlying preference: precision, control, familiarity, and information density. The resulting UI used restrained colors, strong numerical hierarchy, clear segmentation, and highly consistent patterns while still following modern UX principles. I used a restrained green palette and a darker neutral green for system actions, with semantic colors reserved for performance and status. This separation supported instant deviation detection without competing meanings.
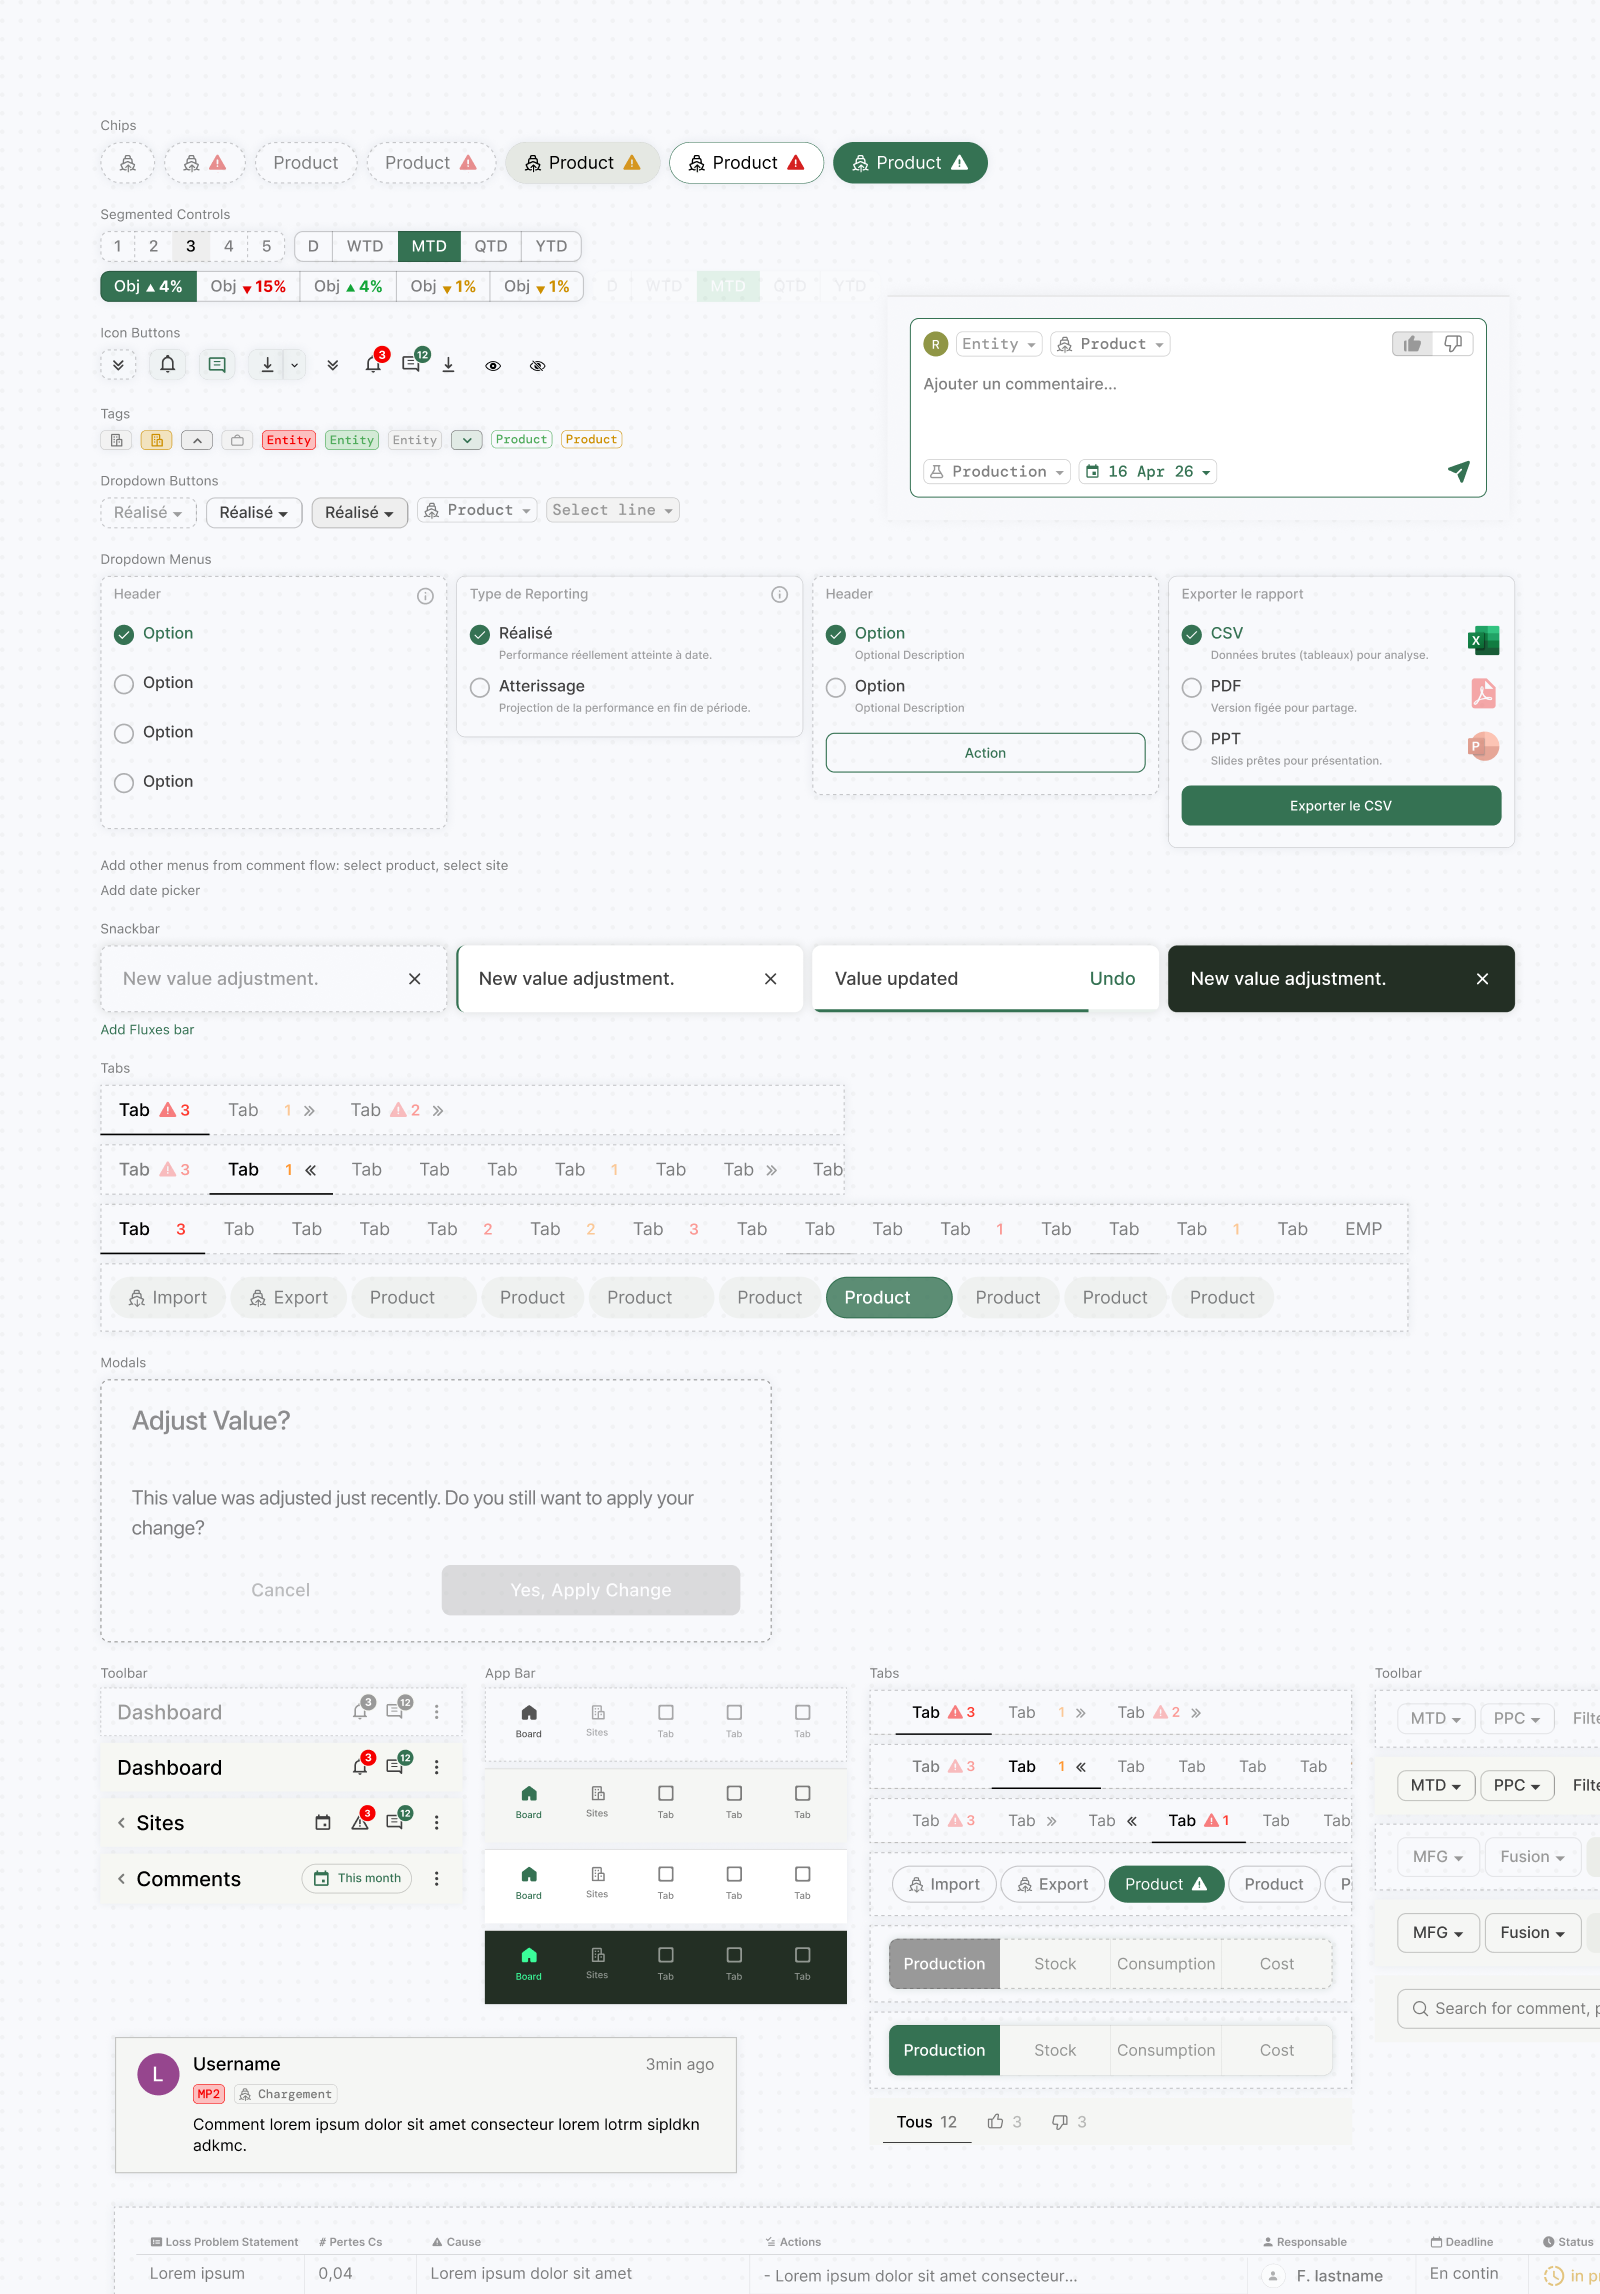
Combined with the dashboard direction described earlier, this approach was one of the first concepts that immediately resonated with stakeholders. While details such as charts, icons, shadows, and navigation treatments continued to evolve through feedback, the overall visual direction remained stable throughout the project.
Designing how to move between reporting contexts
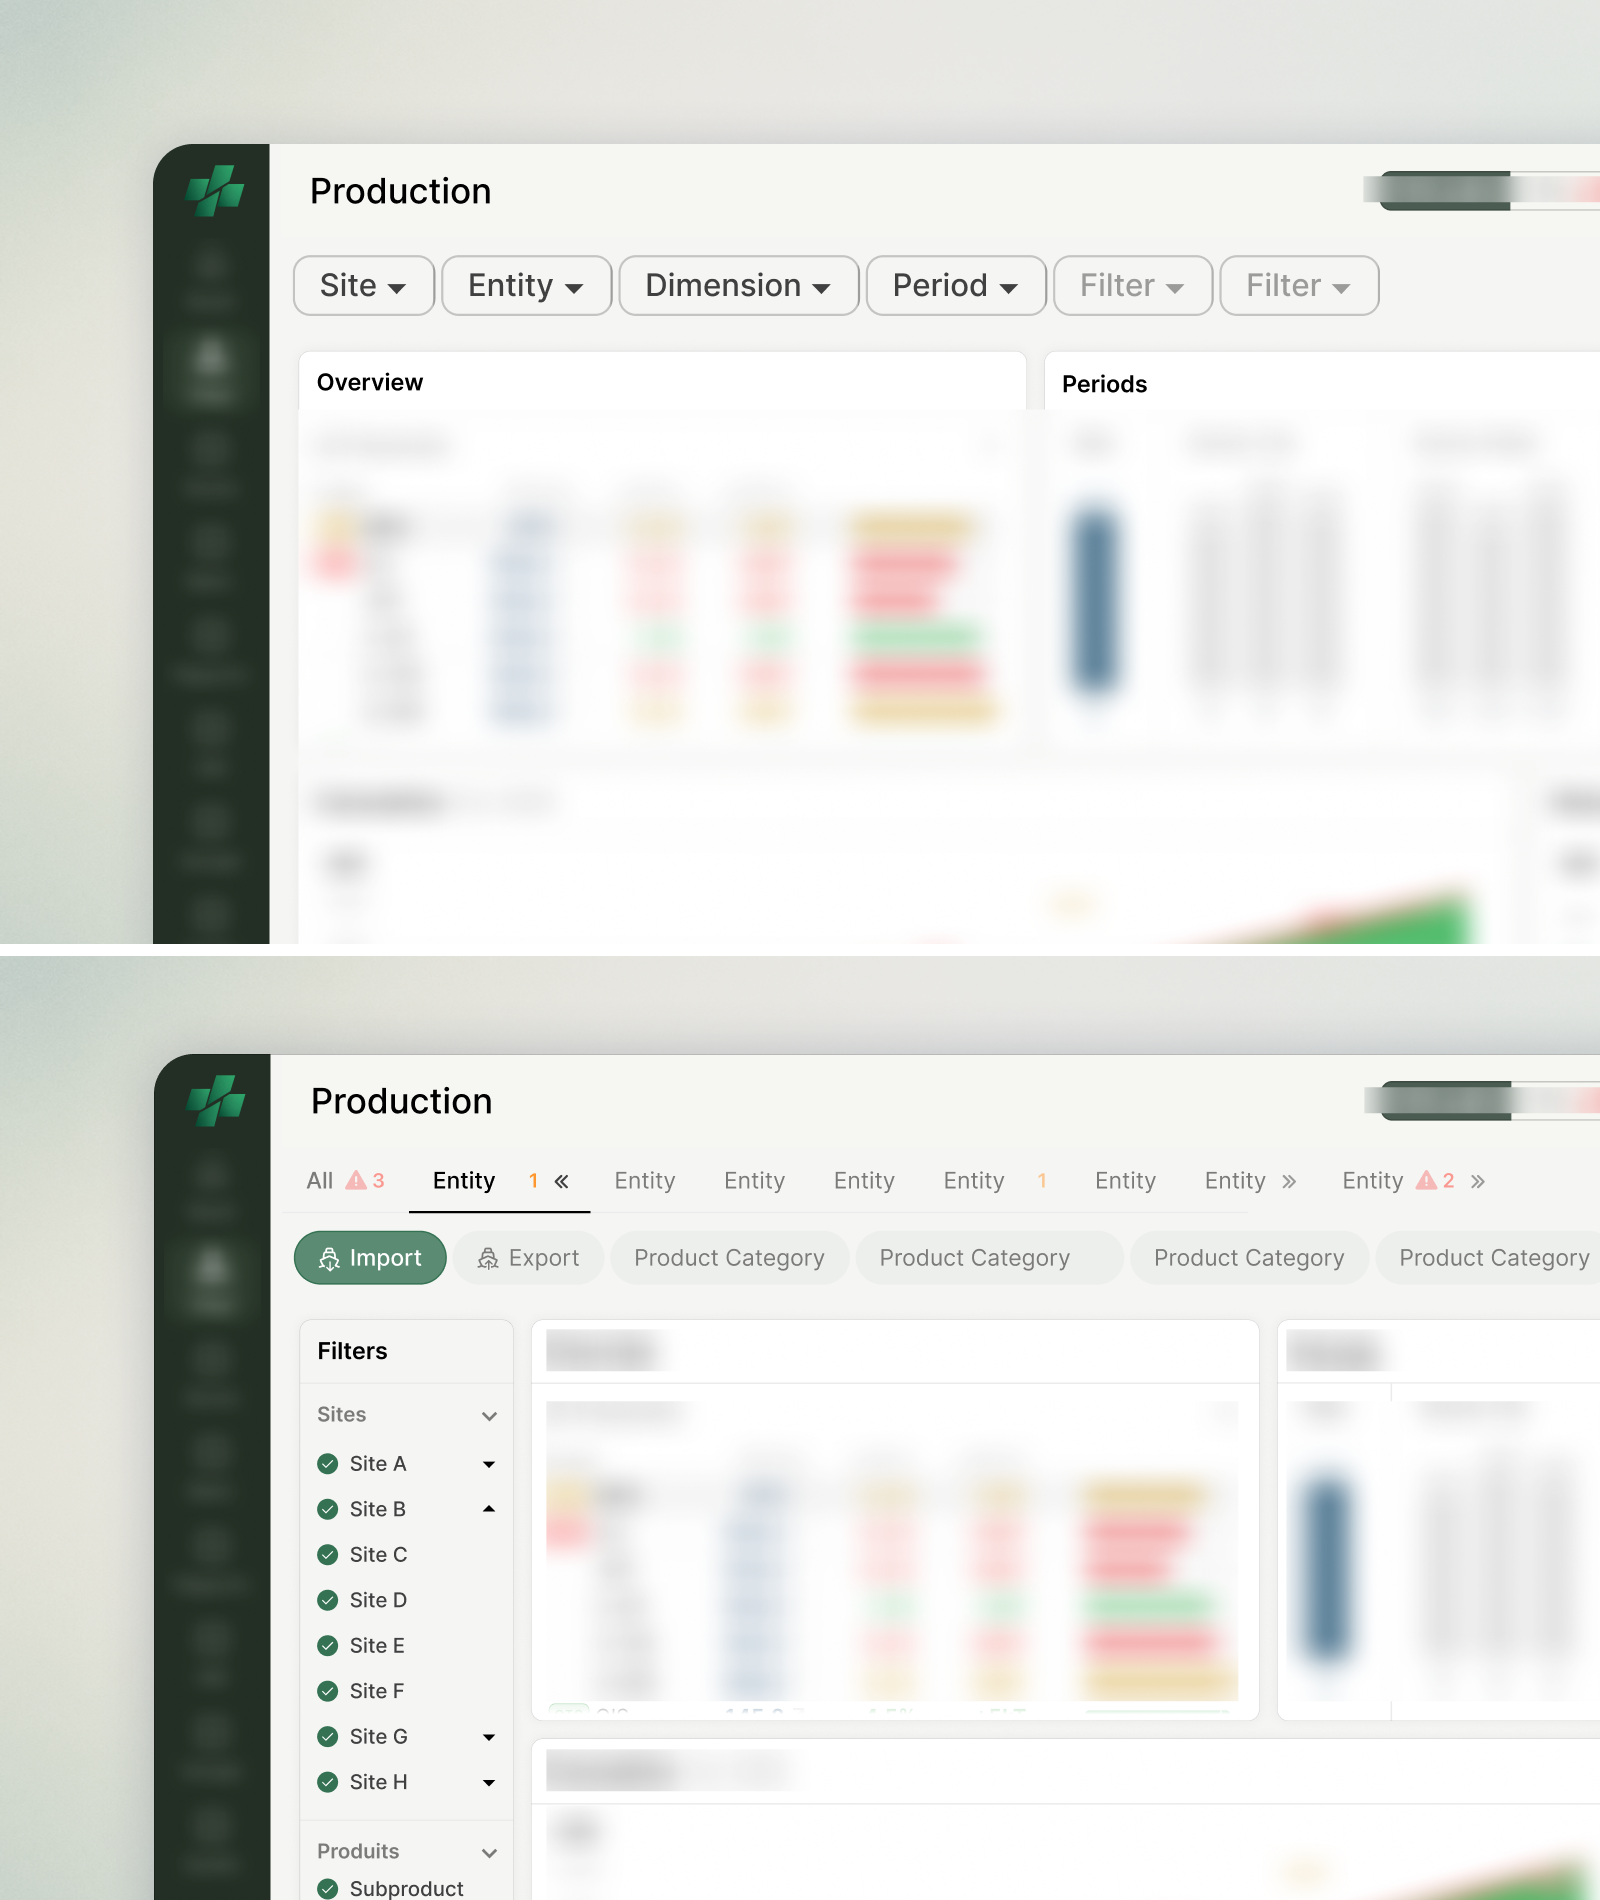
One of the earliest architectural challenges I underestimated was how to structure detailed performance reporting. The platform had to support multiple sites, products, dates, and performance dimensions. The question was whether to organize reports into separate pages, distinct views, or a single screen controlled through filters.My initial instinct was to use a conventional reporting screen: a single page with charts and filters for performance type, site, product, date, and additional options. I expected this to minimize navigation and accommodate new reporting needs. However, early validation sessions revealed a flaw. Users frequently jumped between sites and products during performance reviews. Repeatedly opening dropdowns, searching, and selecting created too much friction for a workflow that depended on quick switching. The next attempt relied on a large filtering sidebar containing all controls. While this made them more accessible, the number of sites, plants, products, and other filters made the panel difficult to navigate. More importantly, stakeholders didn’t see sites as filter values. They saw each site as a distinct operational entity with its own products, performance, and operational reality.
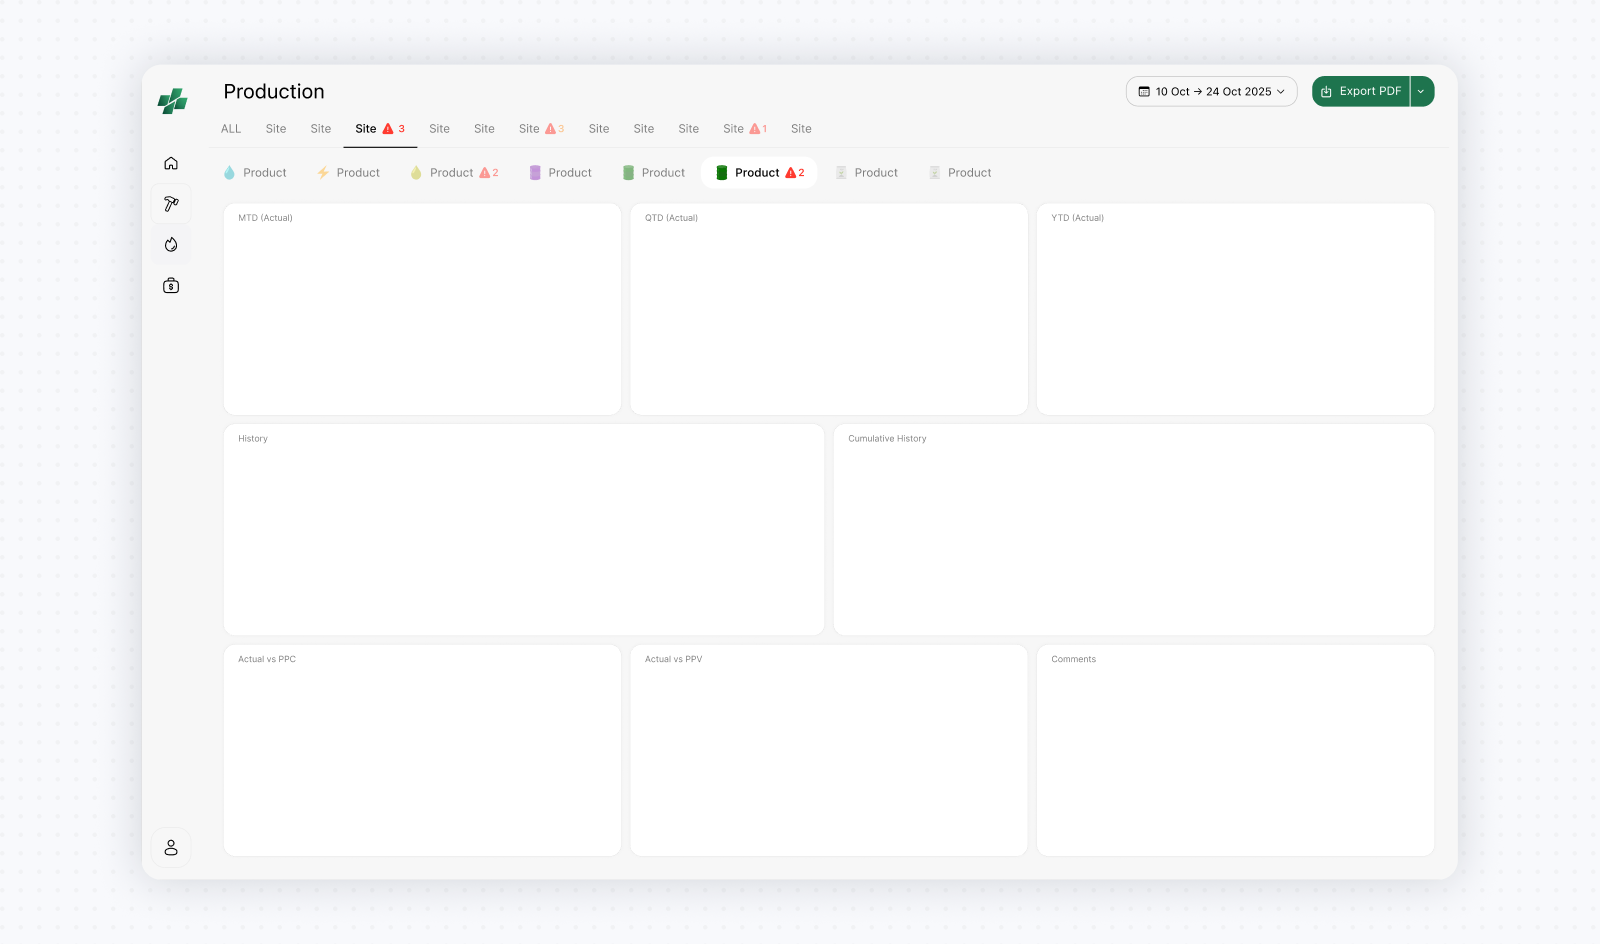
The breakthrough came during a validation session where I presented several navigation directions. One organized sites as tabs and product families as chips within each site, revisiting an early operational reporting concept set aside while we prioritized the Executive Summary. Unlike previous concepts that required explanation, this one was immediately understood because it mirrored how users already reviewed performance. Sites became the primary navigation layer, while product families became a secondary layer within each site’s context. Even then, new challenges emerged. Some sites represented groups of multiple sub-sites, while some product families contained dozens of products. Showing everything as tabs and chips became unmanageable. The compromise was to introduce expandable site tabs and limit chips to major product families. Detailed plant and product selection remained available through a local filtering sidebar, while global controls at the top applied across the reporting view. The filter's sidepanel itself remained controversial because it consumed valuable screen width that could otherwise be used by charts. but users consistently preferred keeping filters visible and accessible. The expandable tabs introduced an unconventional interaction that I initially had reservations about, but it tested well with stakeholders and proved easy to learn in practice.
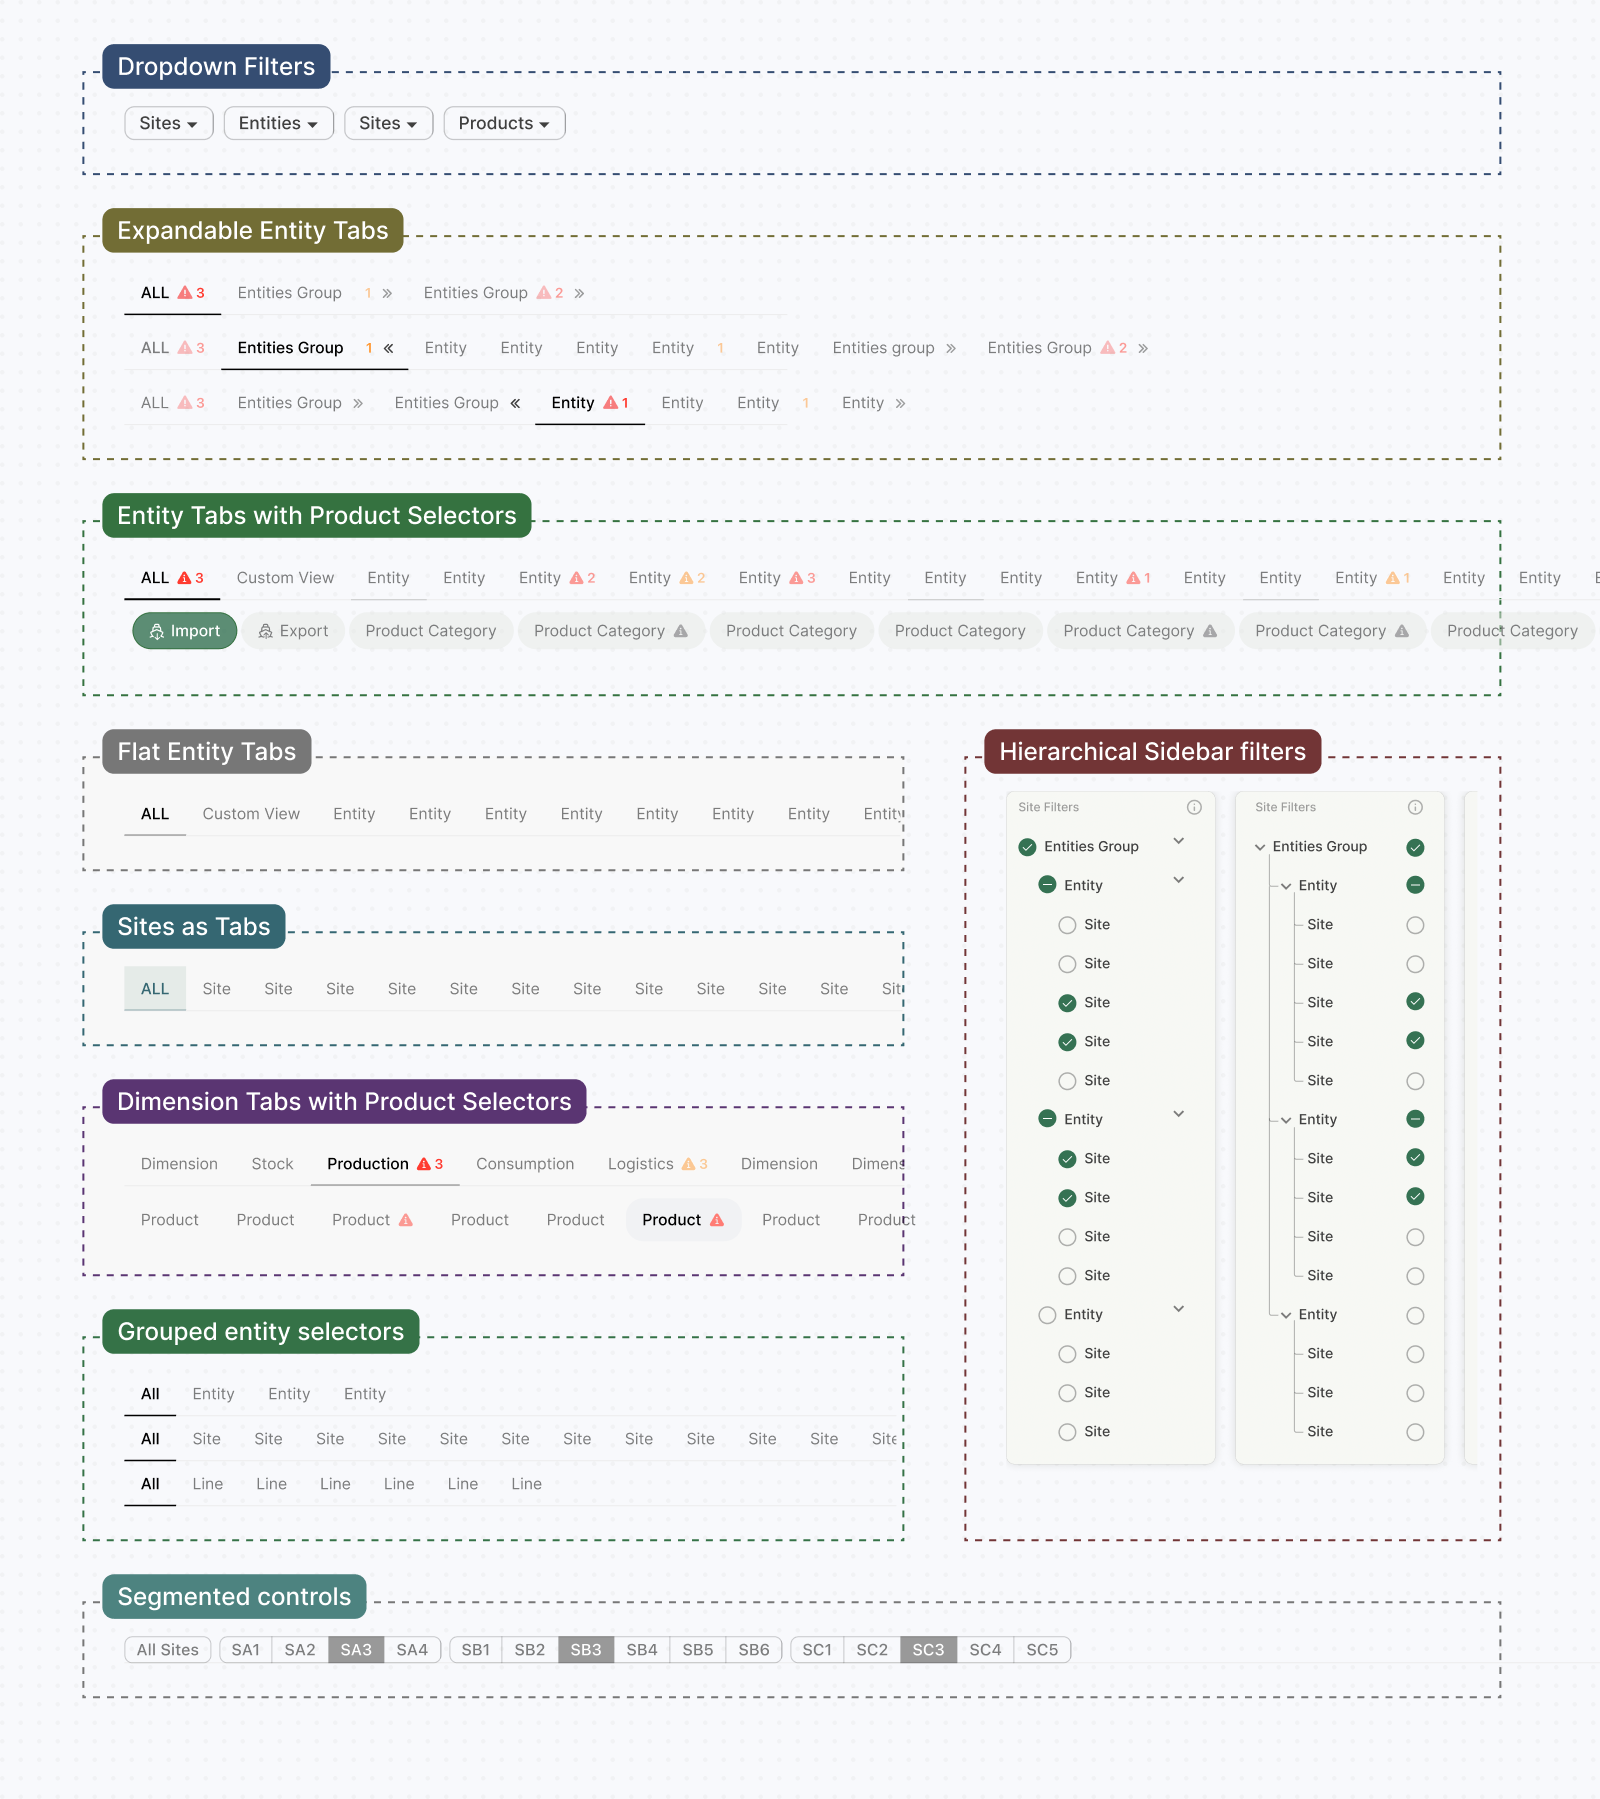
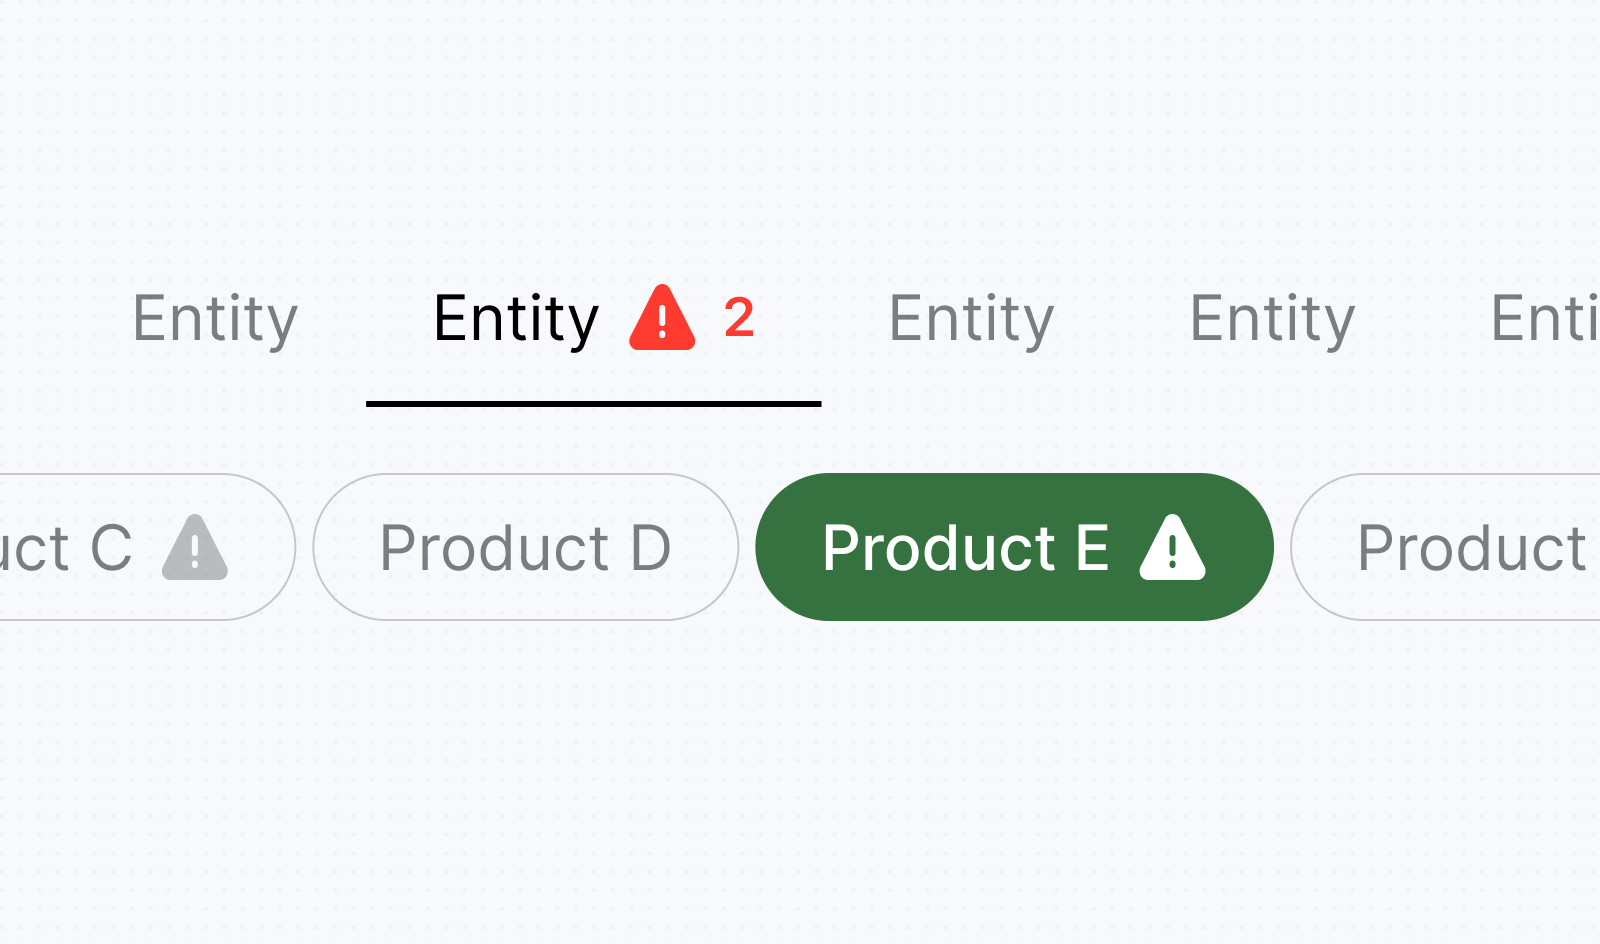
An unexpected benefit was that alert indicators could be embedded directly into tabs and chips, allowing users to see which sites and product families contained issues before opening them. From a technical perspective, these dimensions still behaved as filters applied to the same reporting datasets. In the interface, however, sites became navigation views while products became contextual selectors. This allowed the experience to reflect how users thought about performance rather than how the data was structured.
Designing the Right Performance Charts & Reports
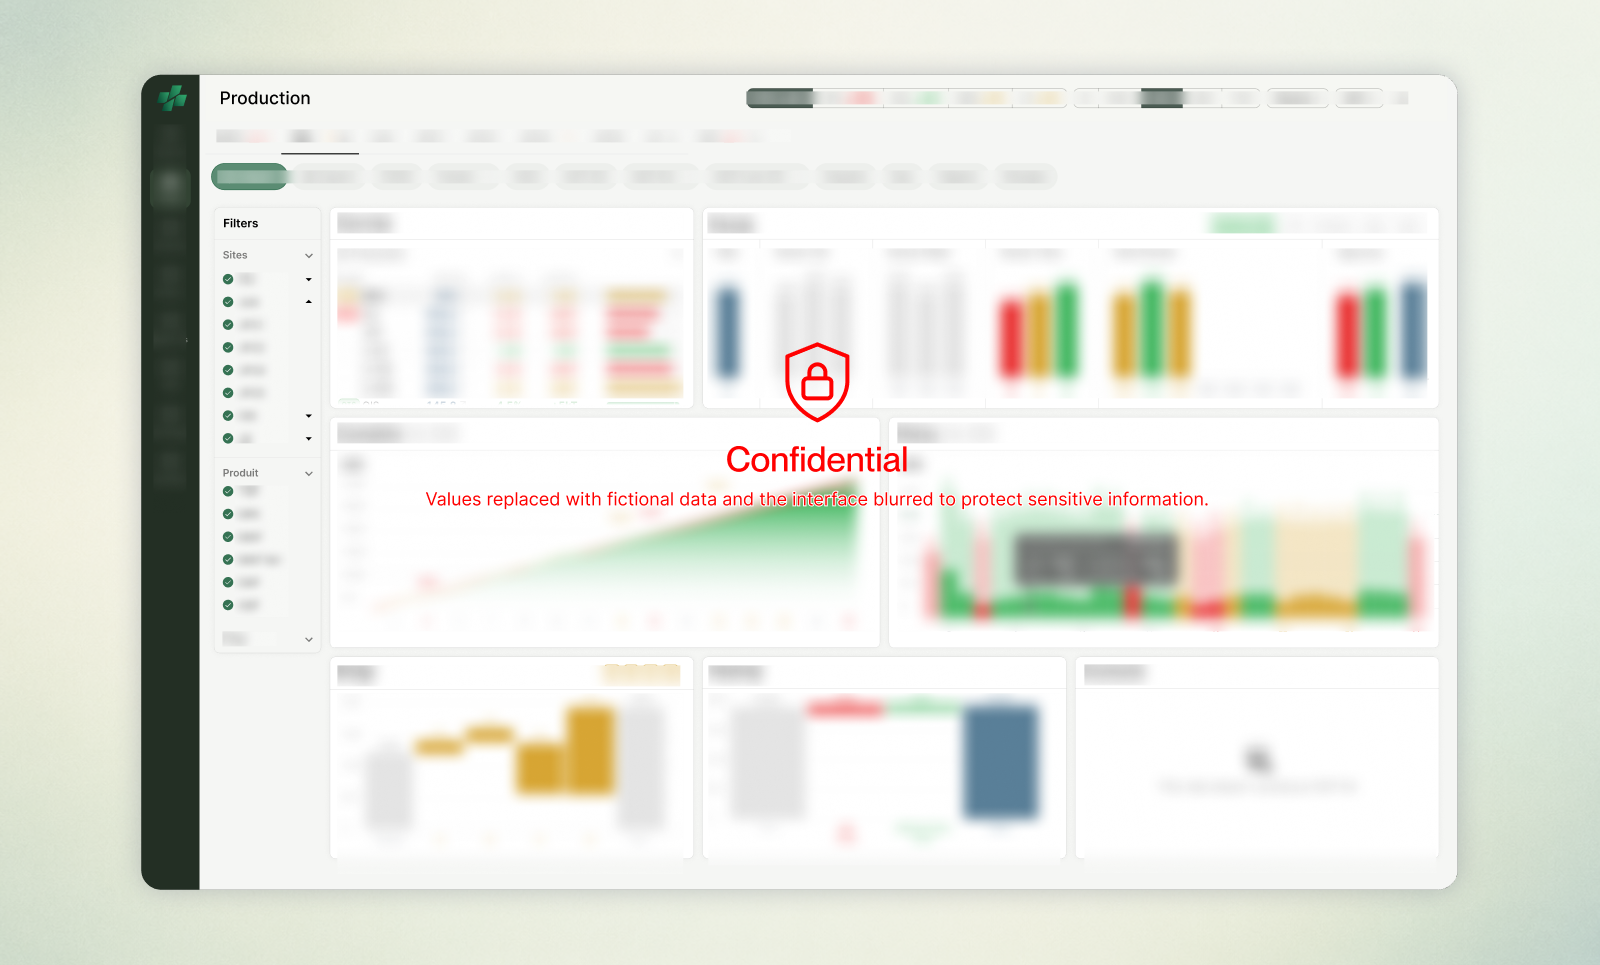
The Executive Summary provided a snapshot of performance. Detailed reporting needed to show how that performance evolved over time across sites, entities, and products. Before deciding how users would navigate these reports, I first had to determine what they should contain. Across the manufacturing ecosystem, hundreds of charts, tables, and indicators existed in spreadsheets and presentations. The challenge was deciding which deserved a place in the platform, which should be improved, which could be simplified, and which could be removed entirely.
For each reporting pattern, I started with the question users needed to answer: how performance evolved over time, how it compared with a benchmark, or which factors contributed to a deviation. This guided the choice of chart and the information shown by default. Units, periods, and benchmarks needed to remain clear so users could interpret the figures in context. Hover details exposed precise values and supporting information without adding permanent clutter, while chart-level controls allowed users to adjust the analysis within the broader reporting context.
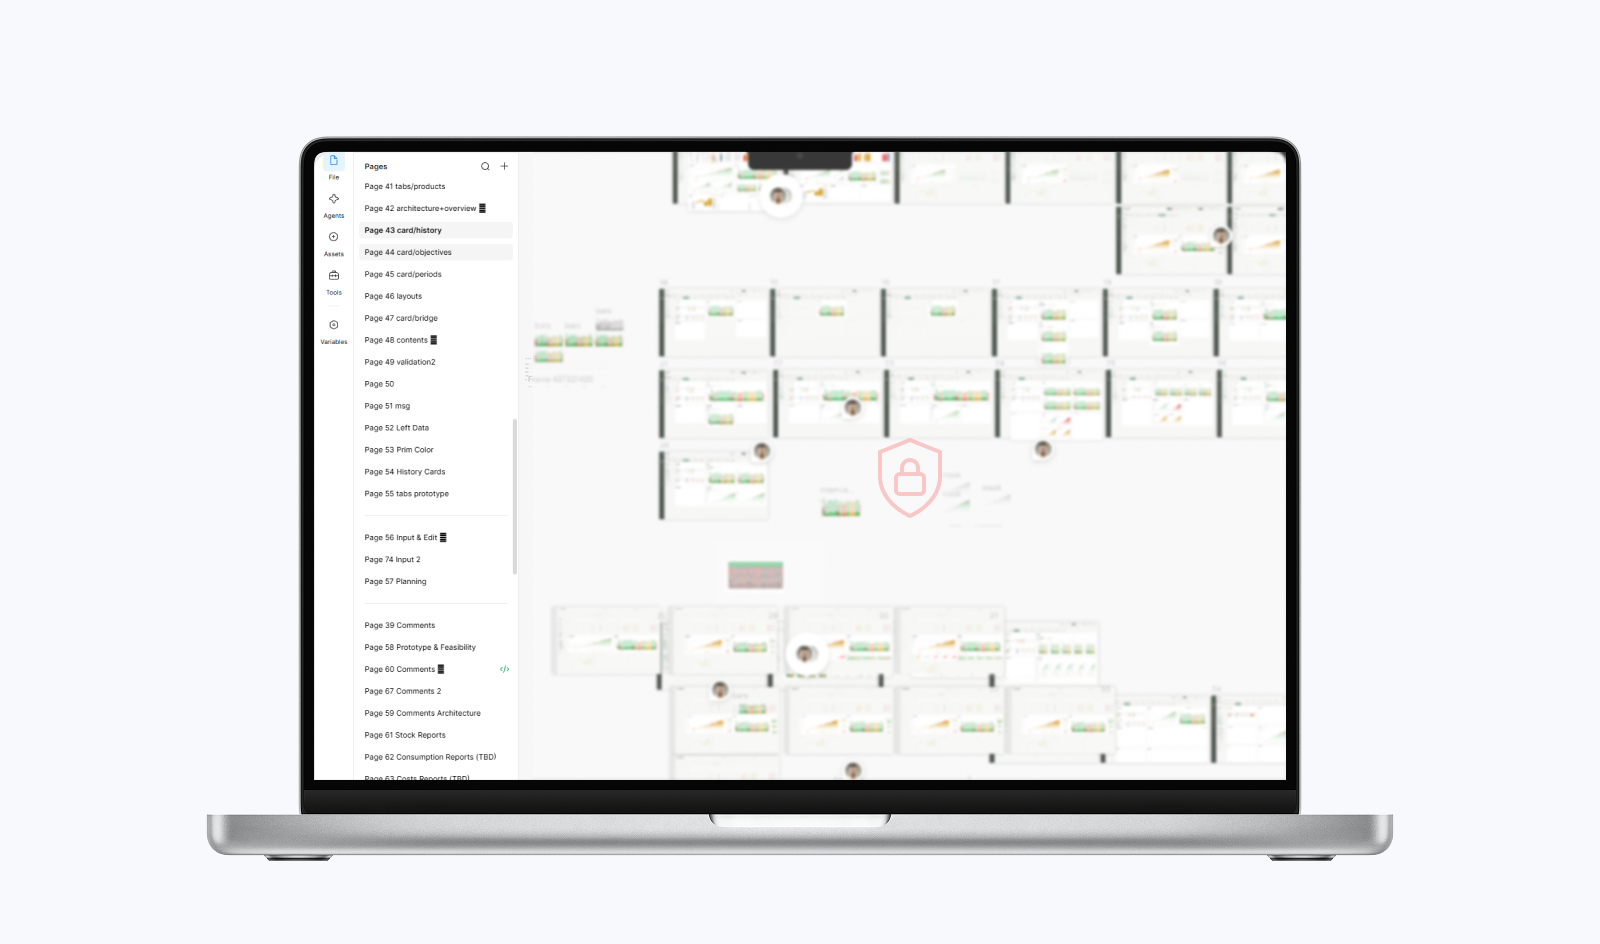
Deconstructing the reports revealed that many were repeated analyses applied to different combinations of sites, products, periods, or performance dimensions, often using different visualizations to communicate the same underlying insight. This shifted the problem towards designing a smaller set of reusable reporting patterns.The challenge was deciding how much to standardize while preserving familiar reporting methods. Some were deeply embedded in operational workflows and needed to be retained, while others could be improved, replaced, or simplified. Significant effort went into improving chart usability through interactions, contextual information, and clearer visual hierarchy.
Multiple grid layouts for report cards were also explored to balance density, readability, and scalability. Different combinations of local and global controls were tested and validated to determine which settings should apply across reports and which belonged to individual charts. This allowed the same reporting patterns to support different operational contexts without recreating every existing report separately.