


Designing Kane, a Flexible Personal Finance System
A self-directed case study on designing and building a personal finance app around flexible reports, contextual transactions, and user-defined category hierarchies. It focuses on the information architecture and interaction decisions required to make a highly connected financial system feel understandable in everyday use.
Note: Kane is a personal project shaped through continued use and implementation rather than a commissioned engagement. This case study focuses on selected system decisions; the product contains more iterations and supporting states than can be shown here.

Context & Goal
Most personal finance apps ask people to adapt to a fixed budgeting model. Kane began from the opposite premise: the financial structure should adapt to the user. Categories can be nested to any depth, reports can open at any level, and the same model connects transaction logging, budgeting, filtering, and analysis. The goal was not simply to add features, but to design a coherent system in which a change made in one place remains understandable everywhere else.
App Overview
App overview illustration to be added.
Details
Design Engineering a System for Financial Reports
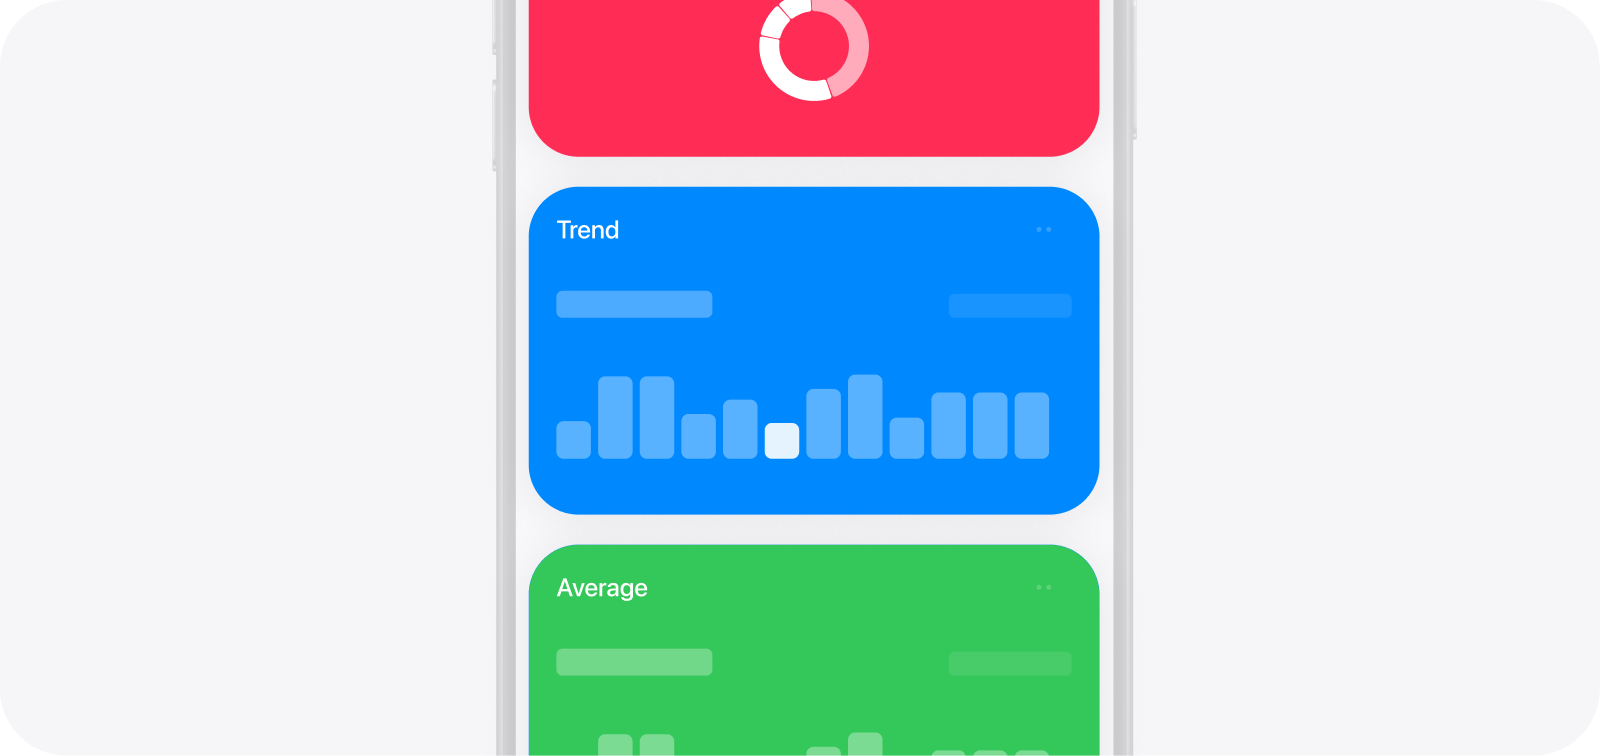
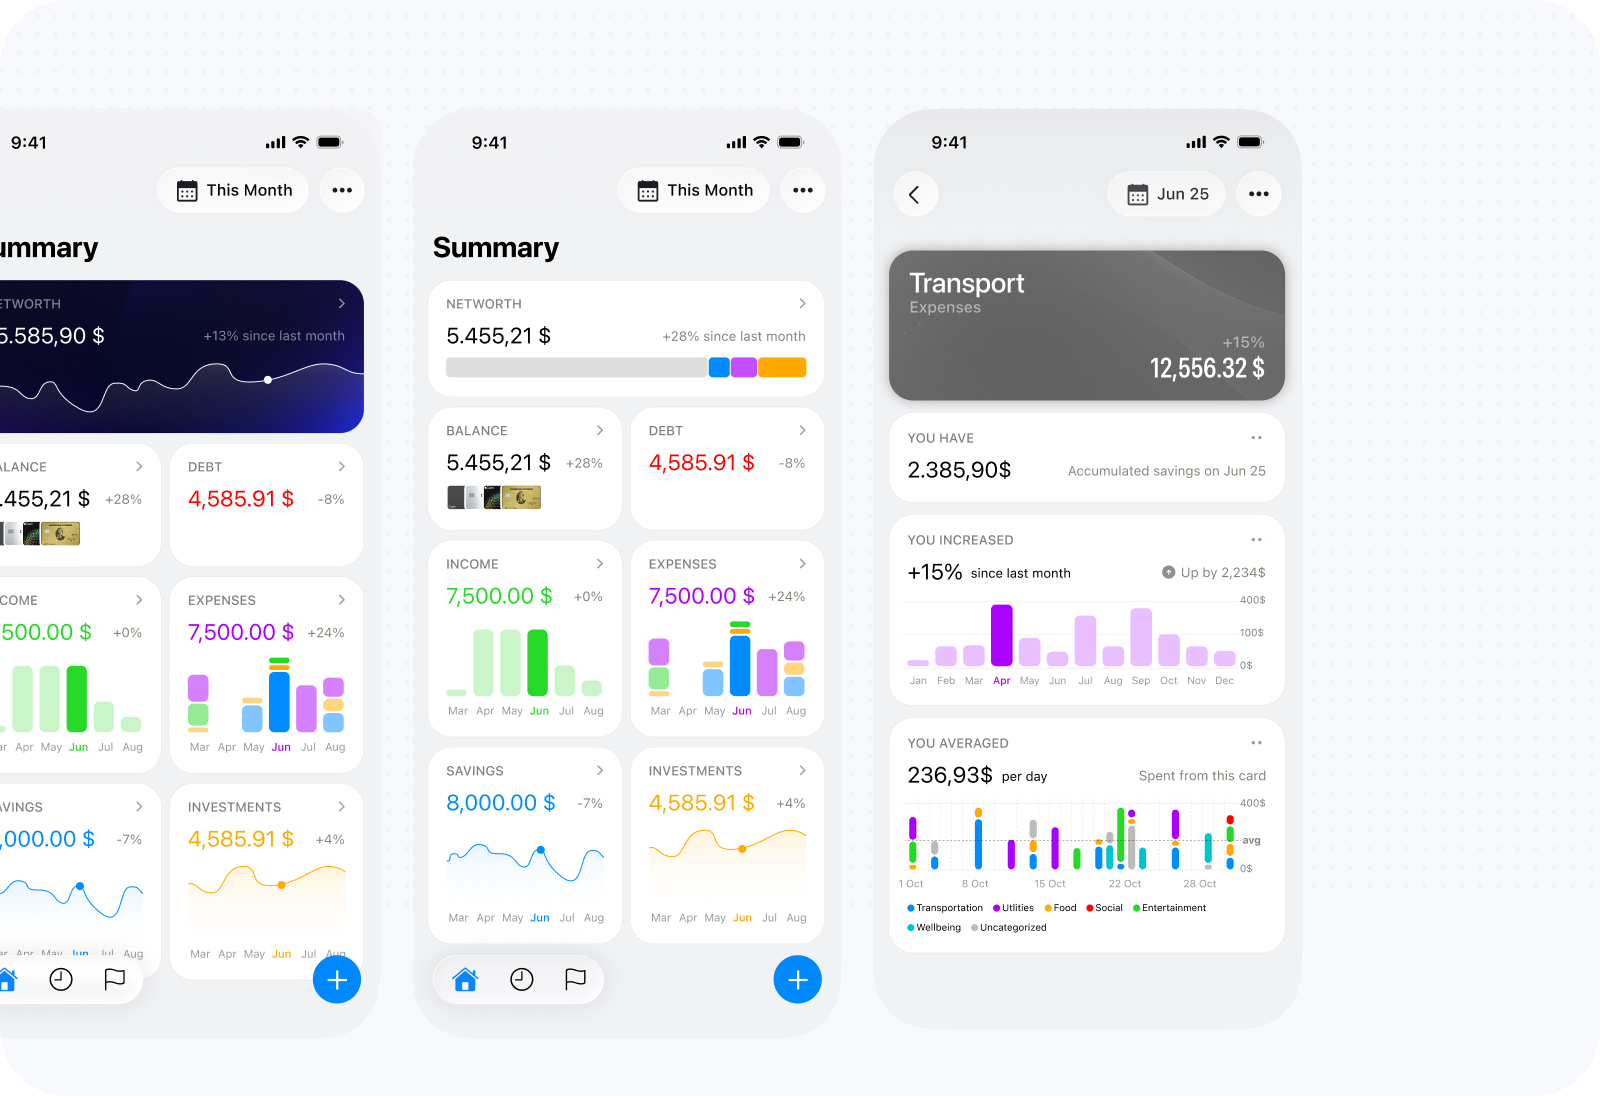
Reports became one of Kane’s most iterated areas. What began as a few charts had to work across real financial data, unlimited category nesting, and any period or combination of periods supported by the Period Picker. The final system uses a small set of cards, each answering a different financial question. Users see brief reports for their highest-level categories on Home, then navigate into any category for deeper analysis. Because both categories and periods are flexible, the same report structure can support a simple financial setup or a deeply personalized one.
Structuring reports around user-defined categories
The most difficult decision was determining what a “report” represented. One fixed screen was easy to scan but limited analysis to the level chosen by the product. A category filter added flexibility but reduced hierarchy to temporary configuration. My guiding principle was absolute power: stop at Expenses when that was enough, or move into Food, Restaurants, and any deeper category with the same reporting capability. I built a recursive architecture in which every category opens a complete report, recalculated around itself and its descendants. Home shows brief reports at the highest level, then leads into progressively more specific ones. Changing the category hierarchy changes the reports rather than forcing users into a predefined taxonomy.
I had first developed this approach in a time-management app, where it proved effective for moving between an overview and increasingly specific areas of tracked time. The same model transferred well to finance. The tradeoff was greater complexity and navigation. Every card, calculation, empty state, and interaction had to work for categories with many descendants and leaves with none. A shared report grammar, clear category context, and a high-level default helped contain that cost. Transactions became supporting evidence inside each category through a compact card and detailed sheet. Categorization now provides control over what is examined, while the shared Period Picker provides the same control over when.
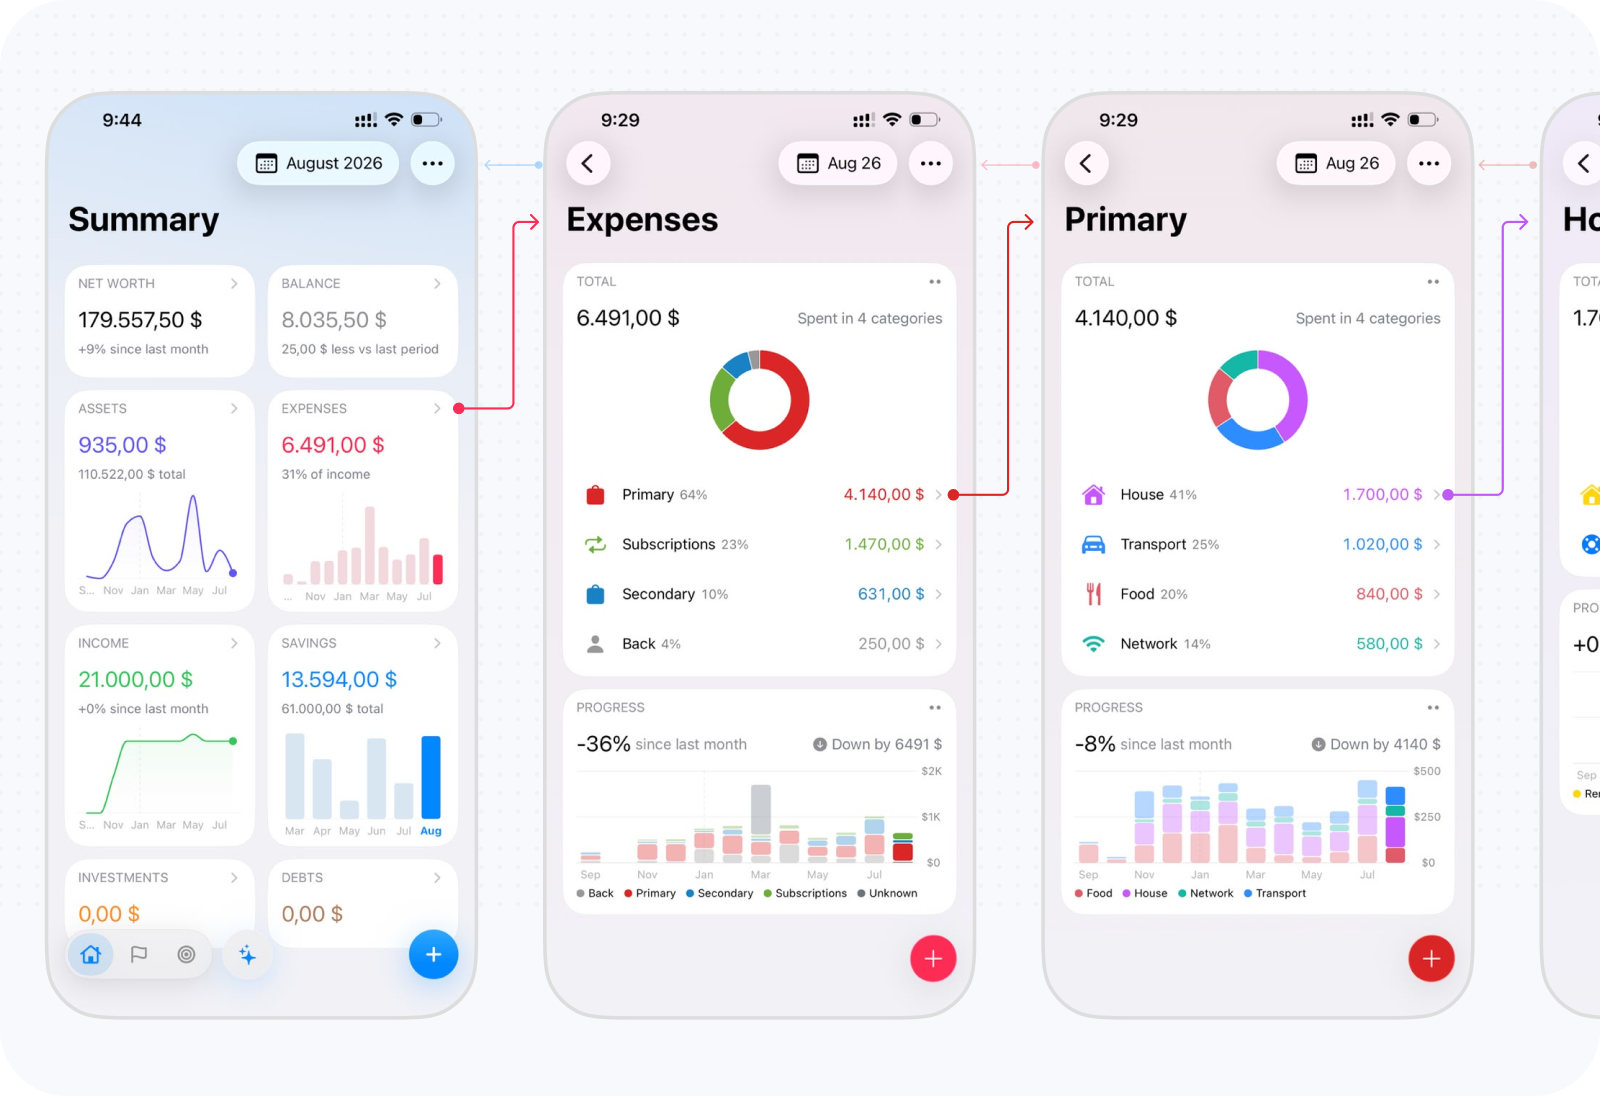
Early reports followed the familiar pattern of one prominent total above category tabs. That worked for a fixed overview, but became less useful as users moved deeper into their own hierarchy. The report needed to take its meaning from the selected category and period, rather than organize every view around the same headline figure.
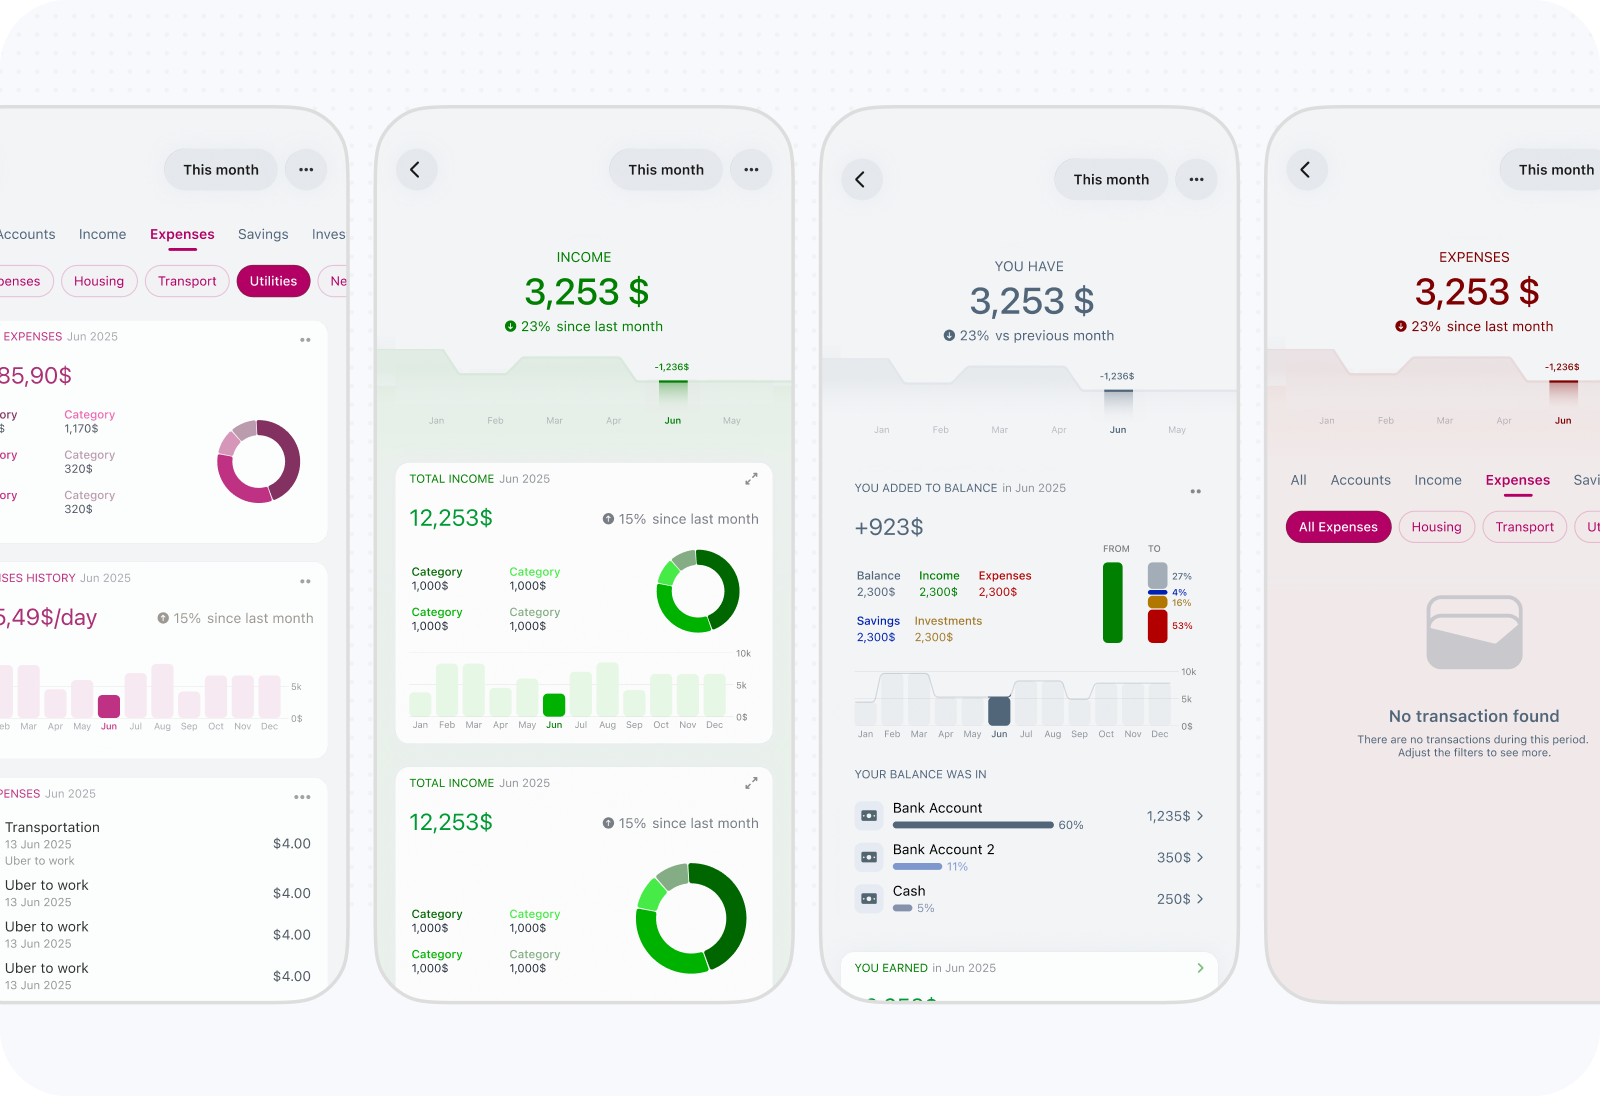
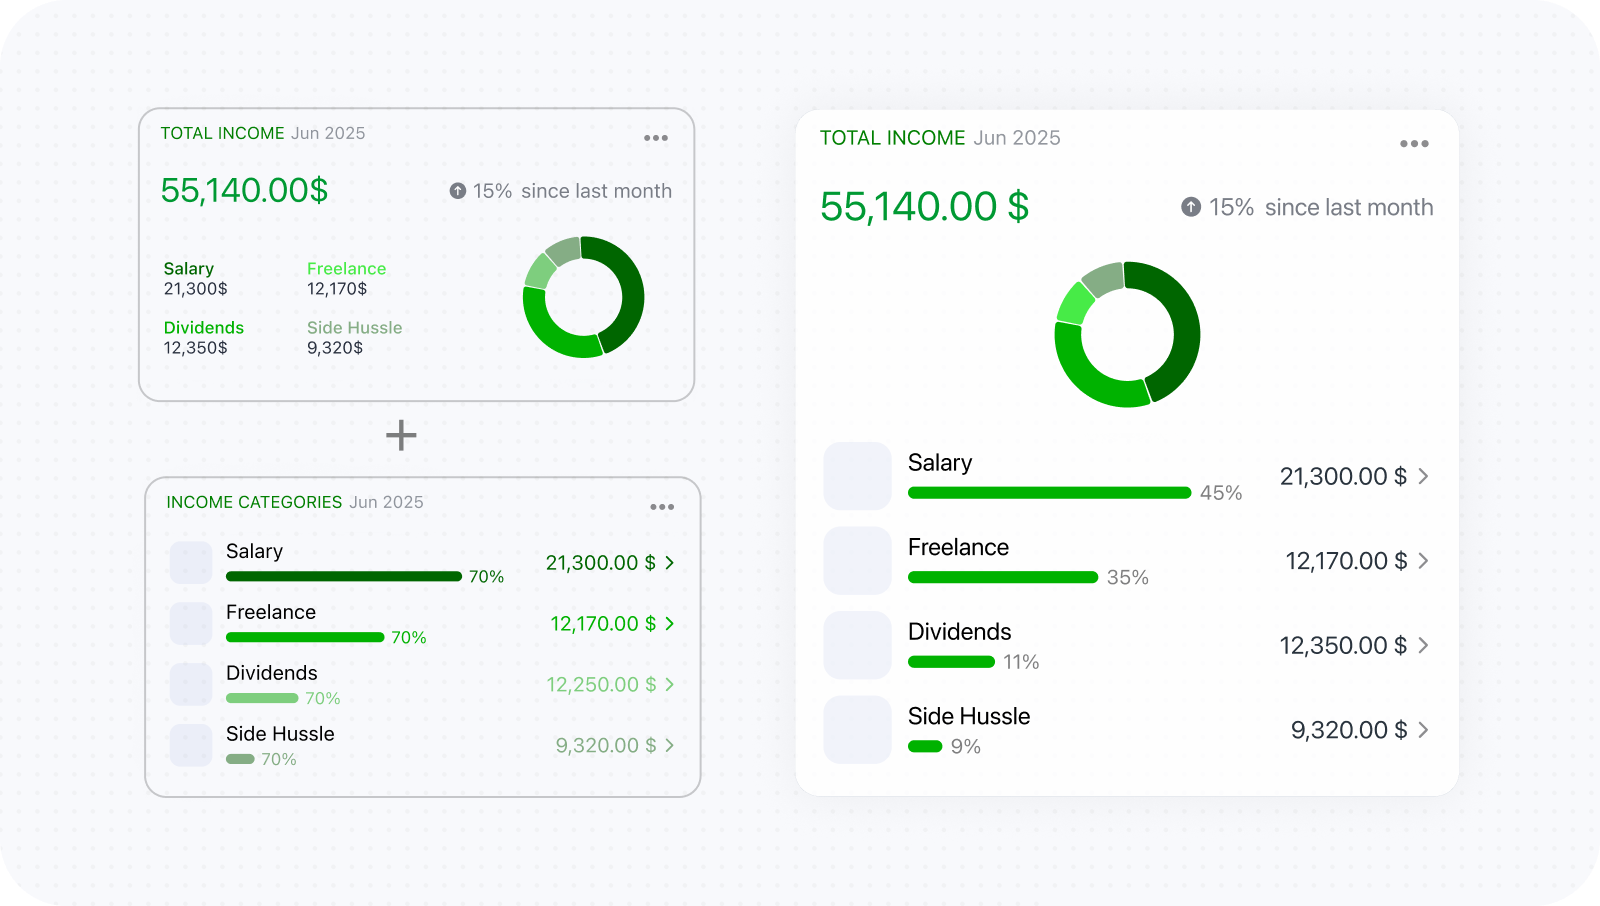
The summary and category breakdown initially occupied separate cards. Understanding a total meant repeatedly looking between the two, so they were merged into one card. The overall figure and the categories explaining it could then be read together.
Structuring reports as modular customizable cards
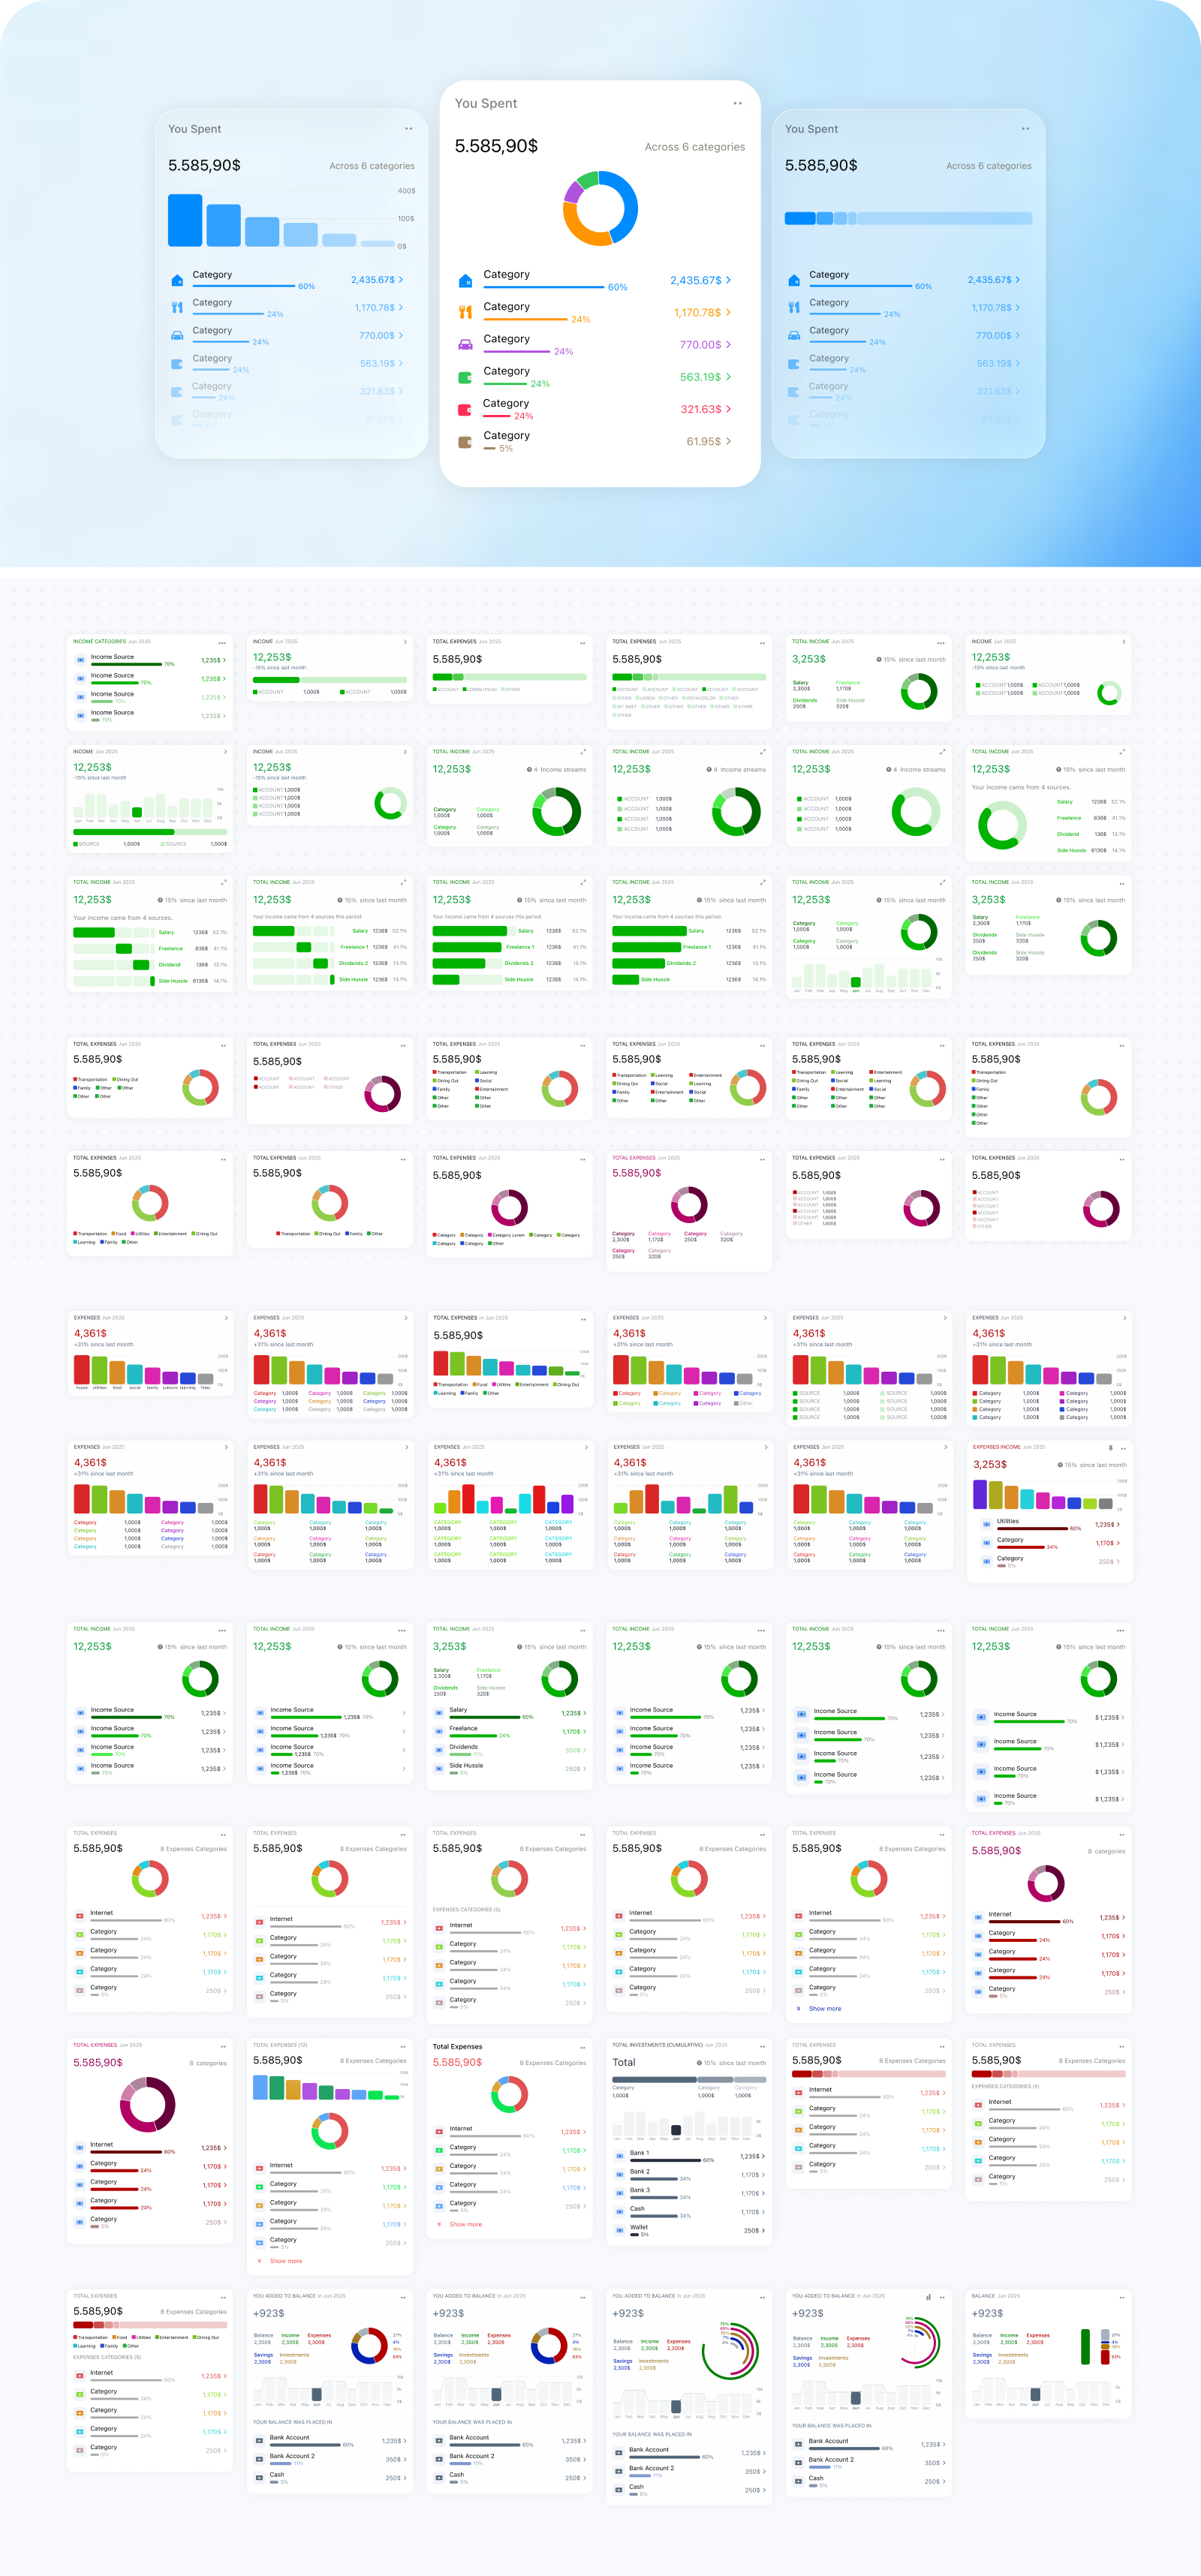
Early versions accumulated useful charts without clearly distinguishing the questions they answered. I organized them into a smaller report grammar:
- Contribution explains the total and what produced it.
- History shows how the result changed across comparable periods.
- Distribution shows how activity was distributed within the selected period.
- Sankey shows how value moved through related financial areas.
- Transactions exposes the individual records behind the result.
- Summary brings key financial figures together for a quick overview.
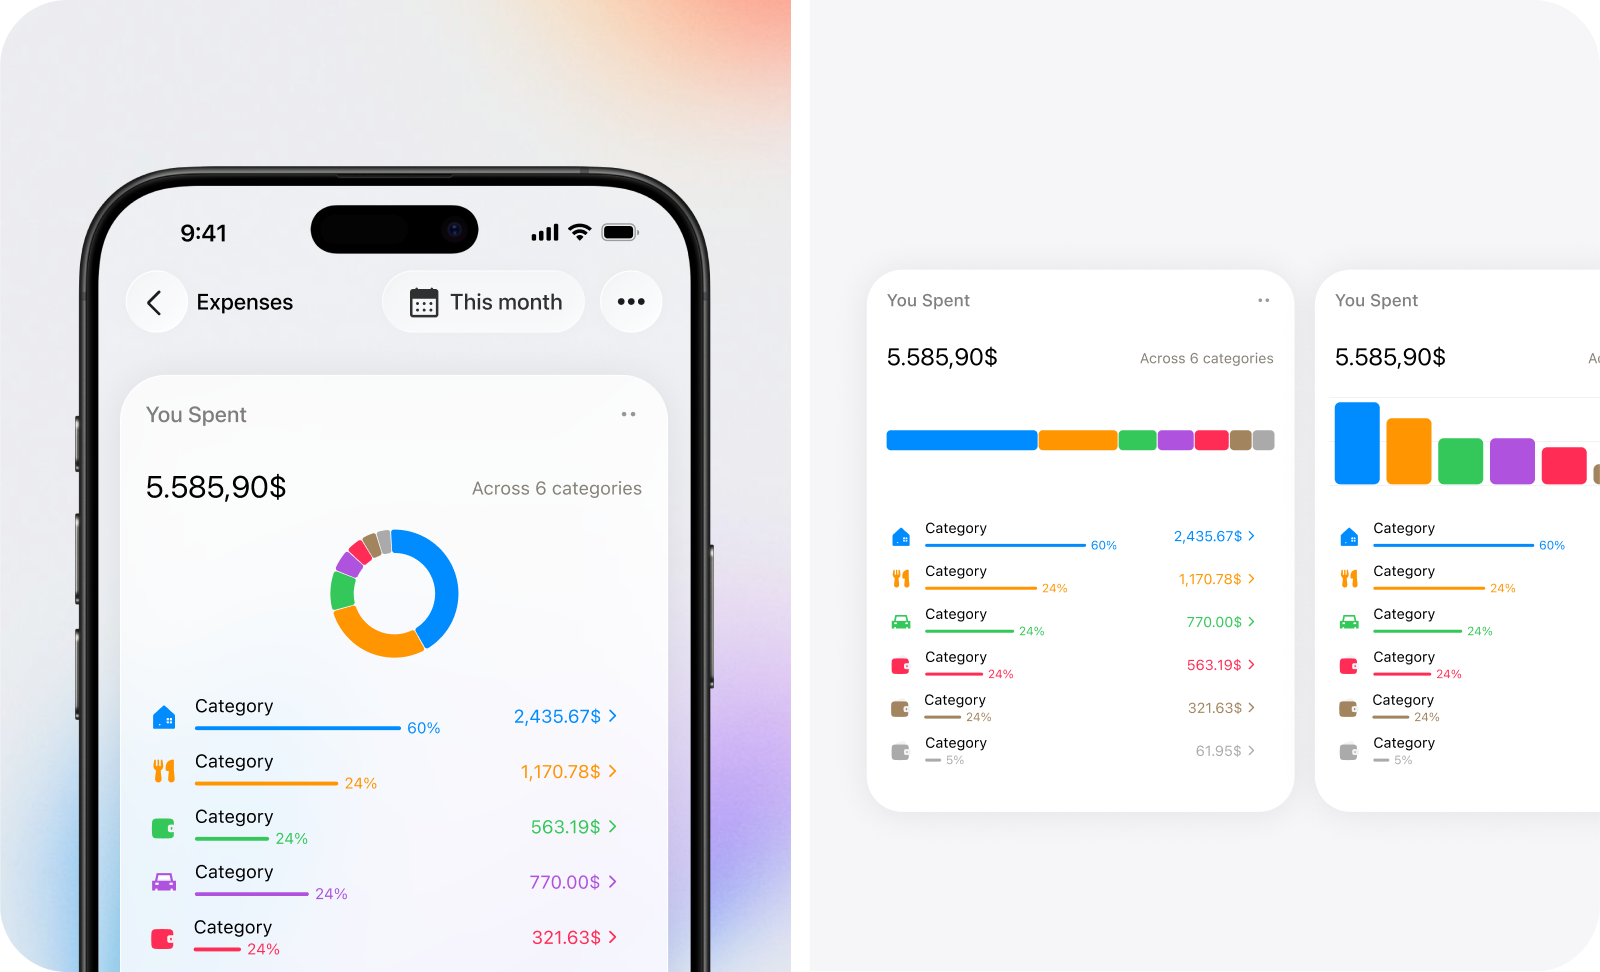
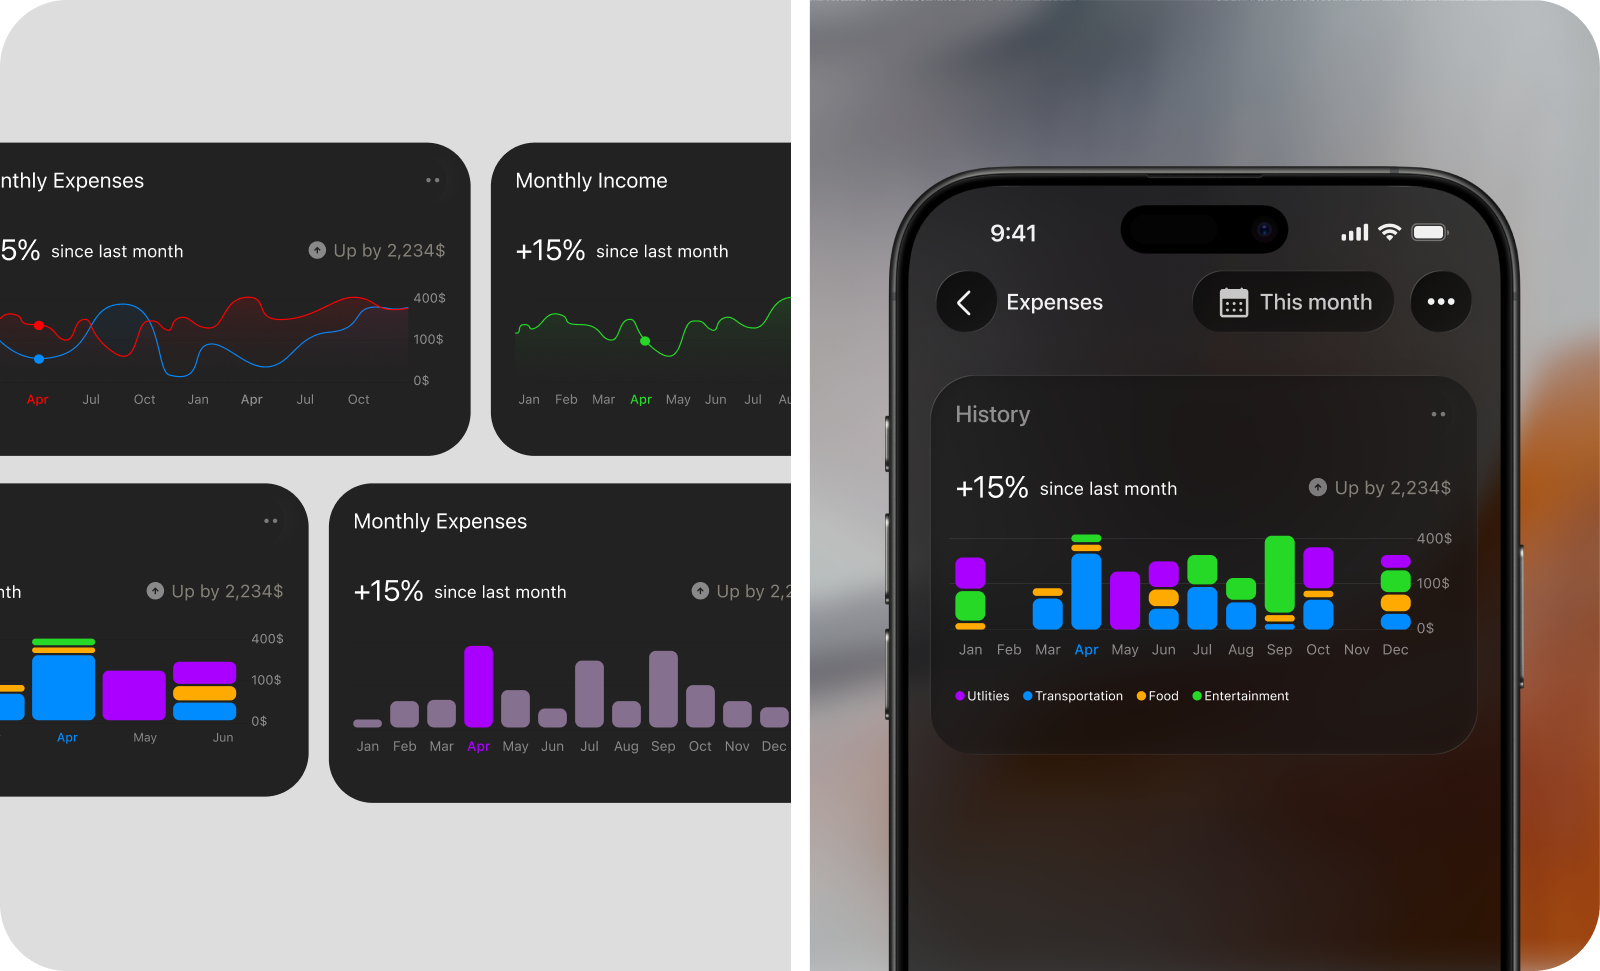
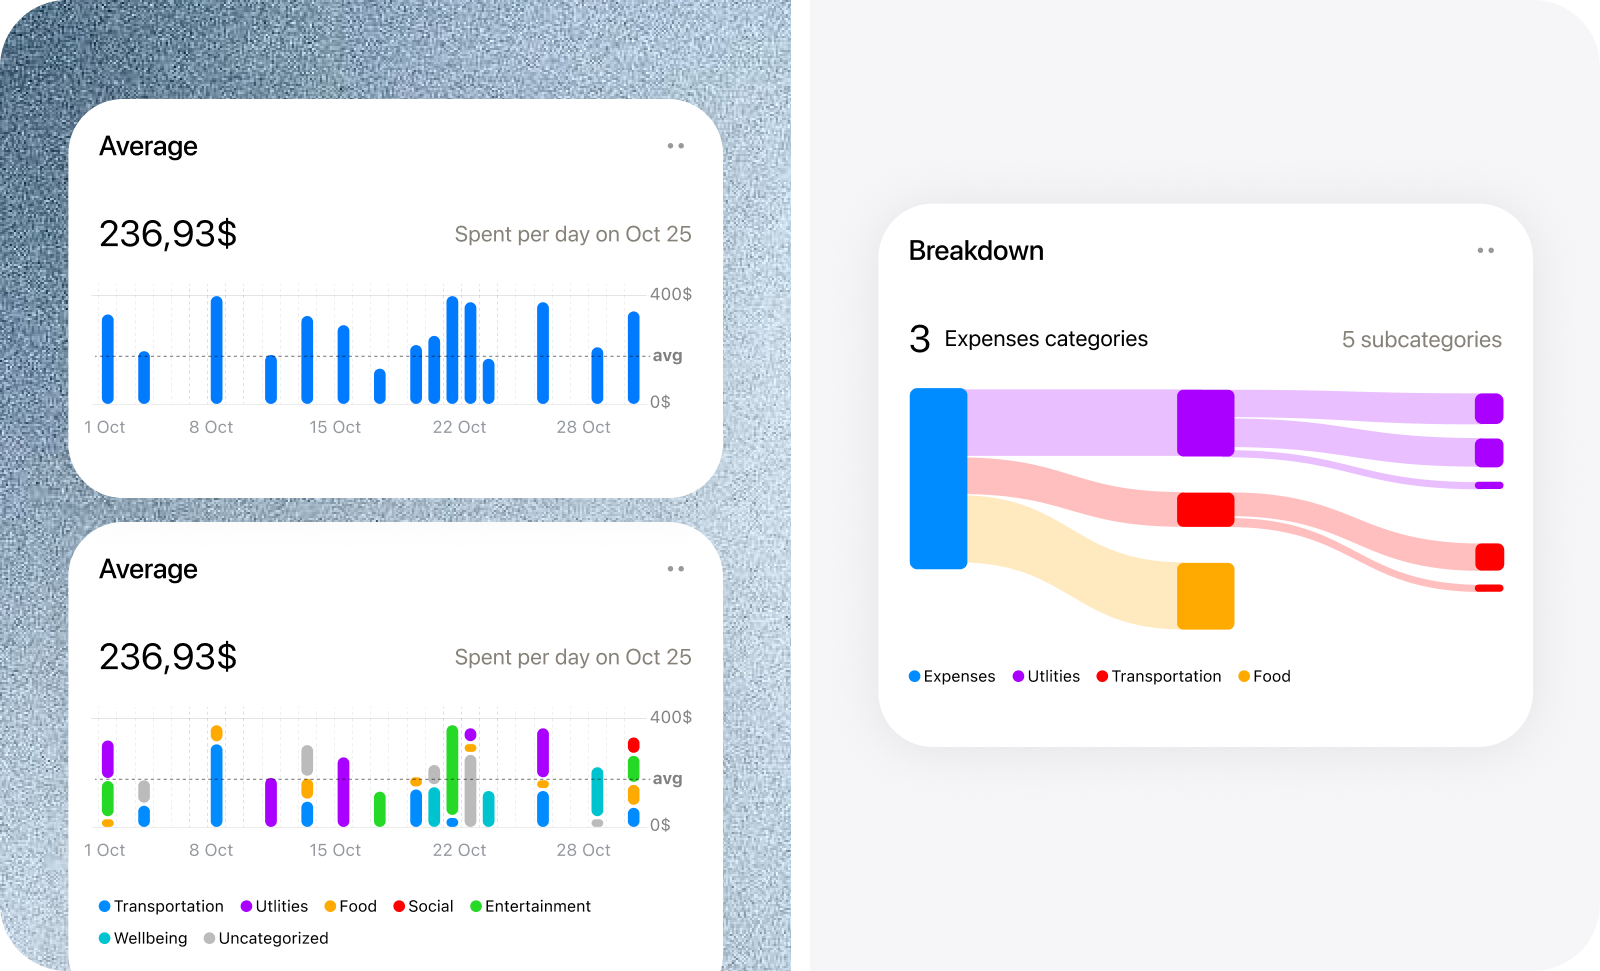
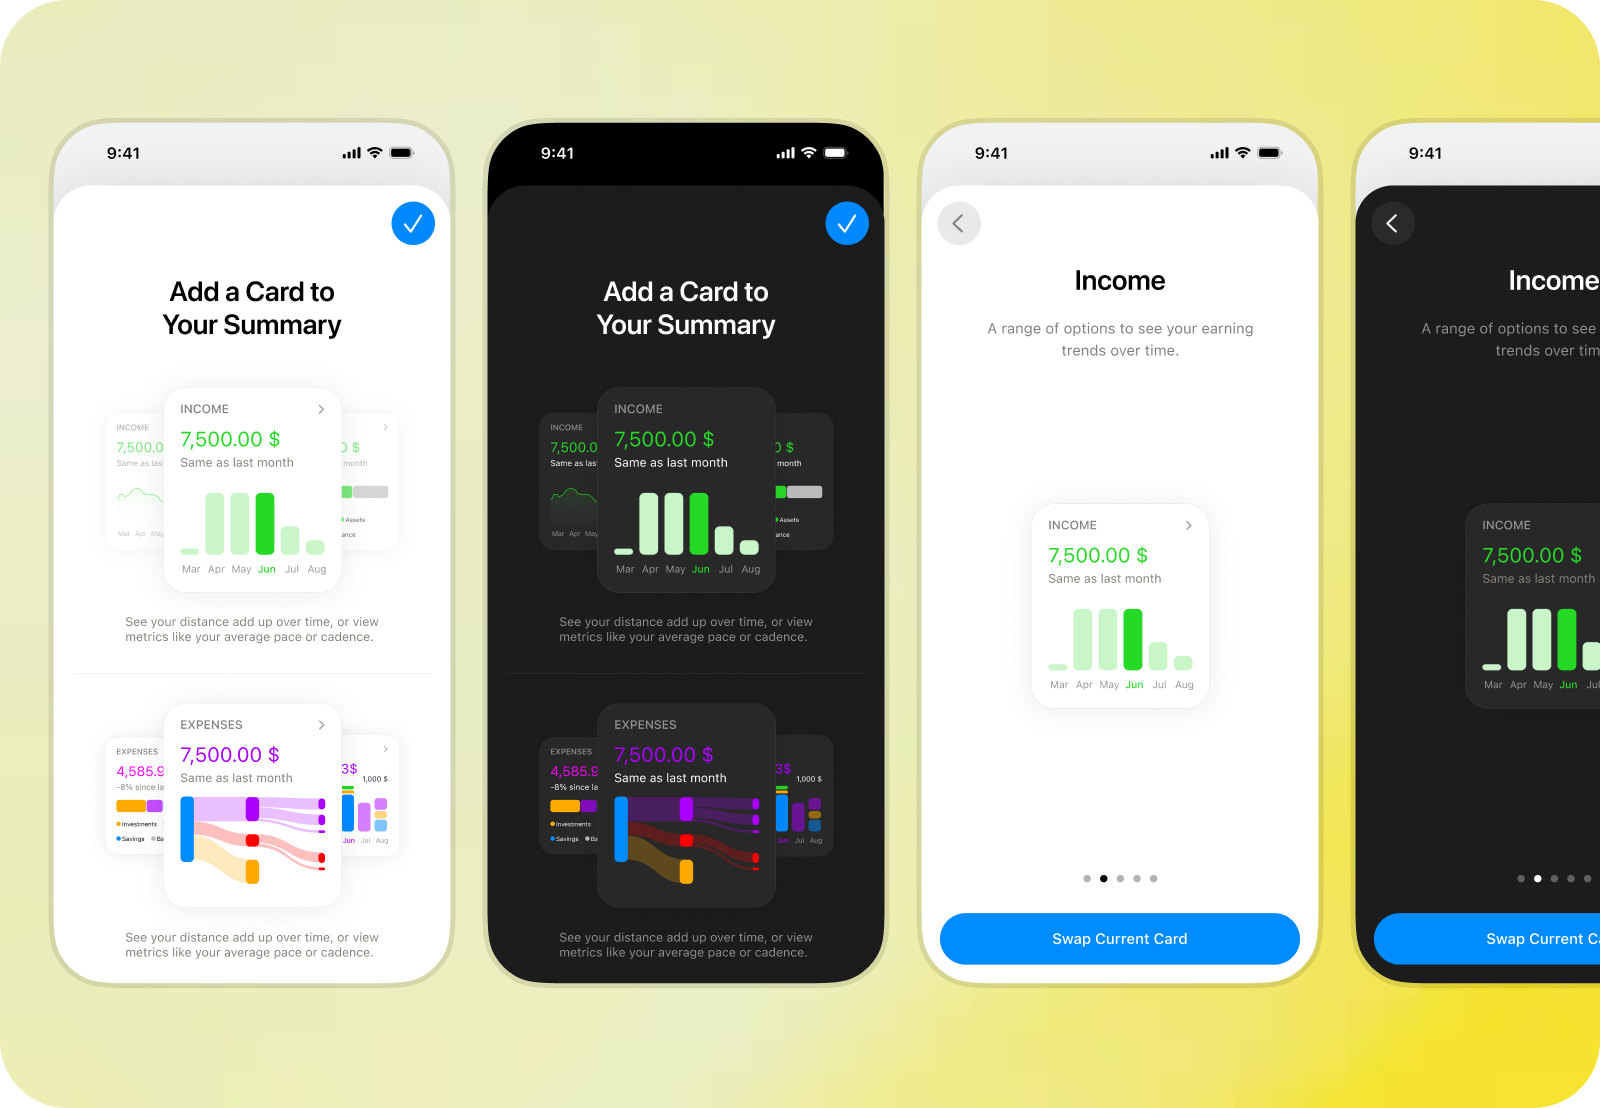
Real data then drove repeated layout iterations. The Contribution Card originally paired a donut with a conventional legend, but Kane’s hierarchy also required amounts, percentages, averages, navigation, and parent–child relationships. I replaced the legend with a ranked list that could expand into subcategories. Three chart options remained, while the list became the stable analytical layer. History gained bar and line views, category visibility, comparison ranges, and direct inspection. Distribution required separate temporal logic: months break into days and daily averages, while longer periods use months and monthly averages. Sankey introduced direction, hierarchy, link, legend, and calculation decisions. Generic labels became statements such as “You spent” and “You averaged,” while category color was reduced to a subtle wash and focused accents. The cards share a structure without being forced into identical behavior.
Building chart foundations that survived real financial data
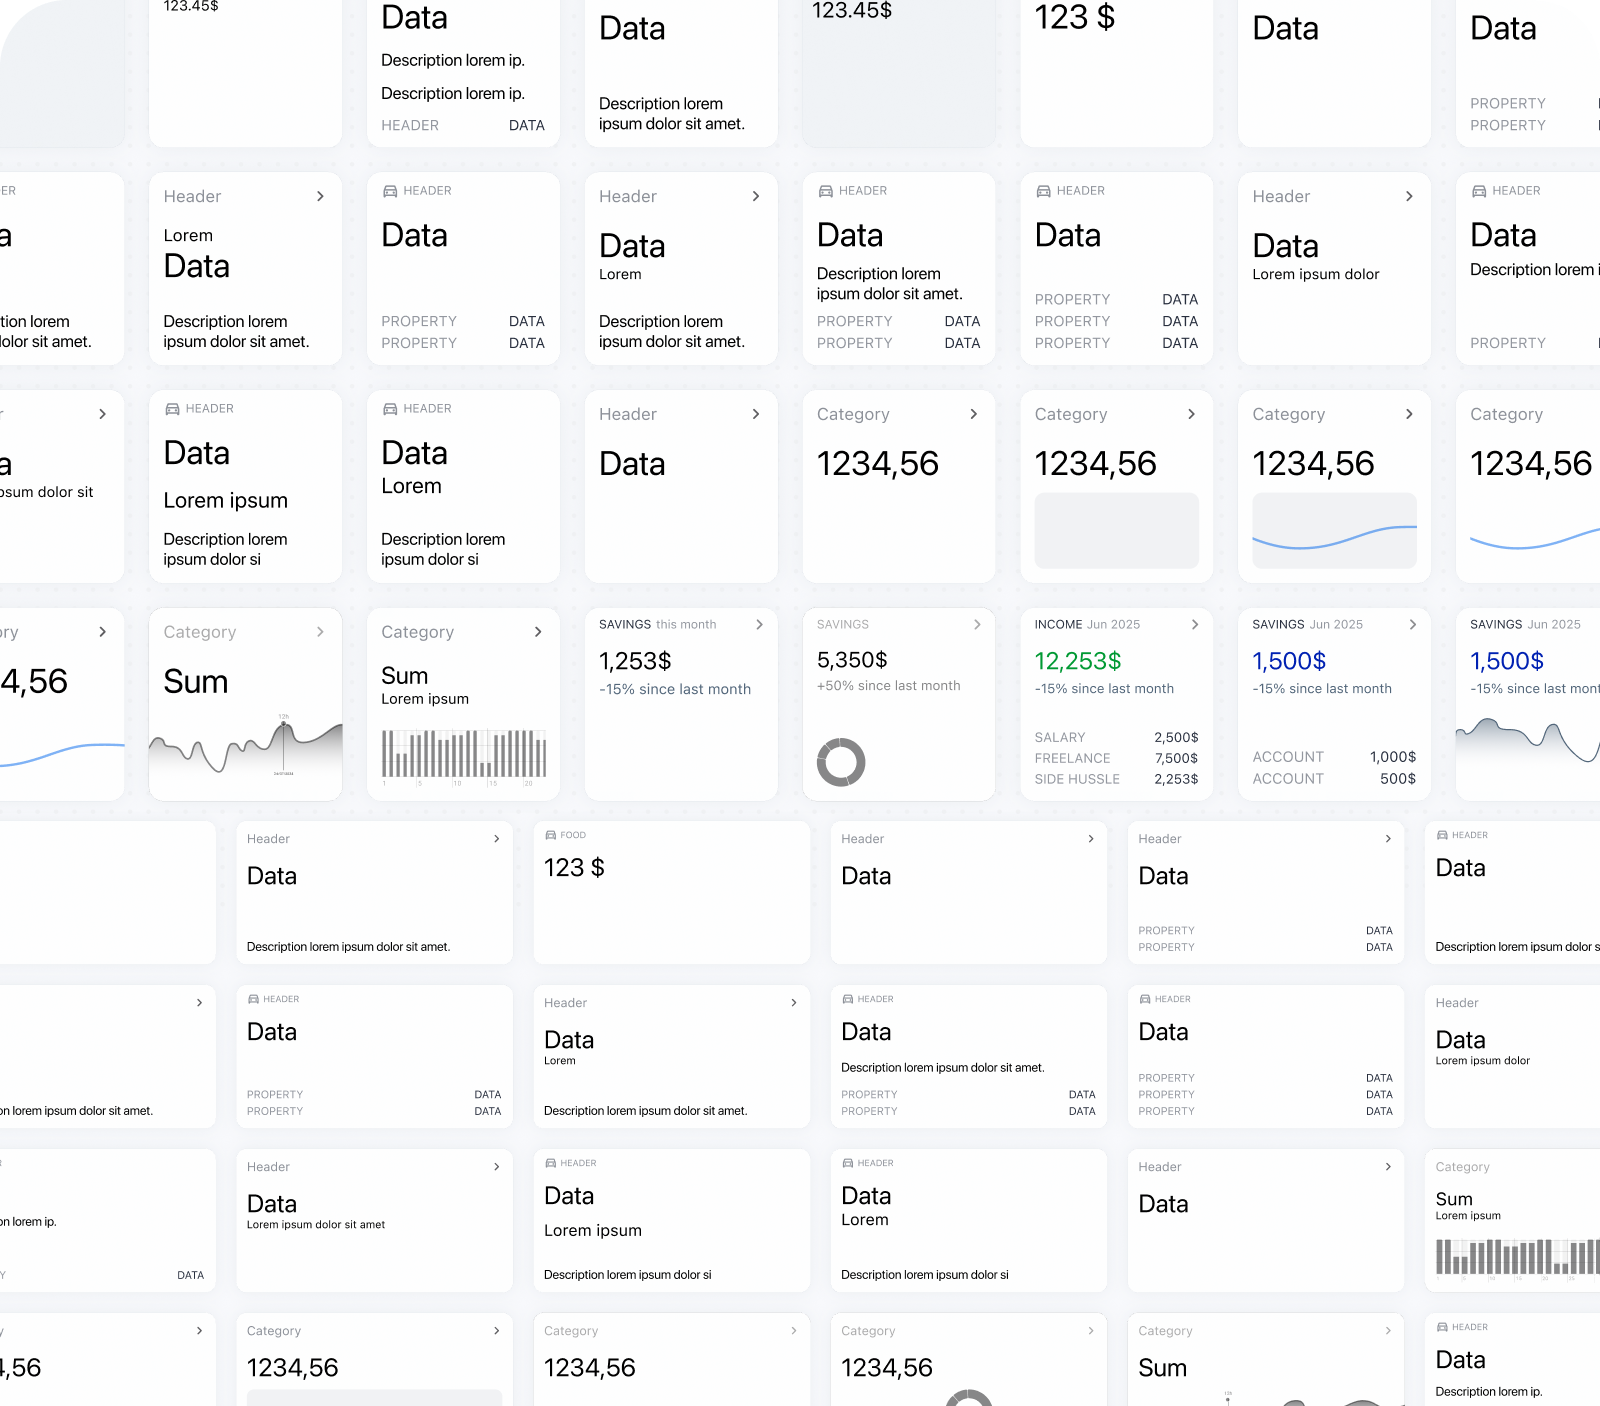
Mock data made the charts appear more resolved than they were. Real records introduced extreme values, empty periods, mixed signs, long labels, large category sets, and irregular custom ranges. The main challenge was coordinating the plot, grid, and axes. Labels had to remain readable without compressing the chart, comparable views needed consistent scales, empty intervals had to stay visible, and time labels had to adapt across every cadence. Shared grouping, scaling, and formatting rules prevented each card from solving these cases differently. Tooltips remained only where inspection added value. I removed them from the contribution donut because positioning was unreliable and the list already exposed exact values.
Prioritizing practical value over analytical depth
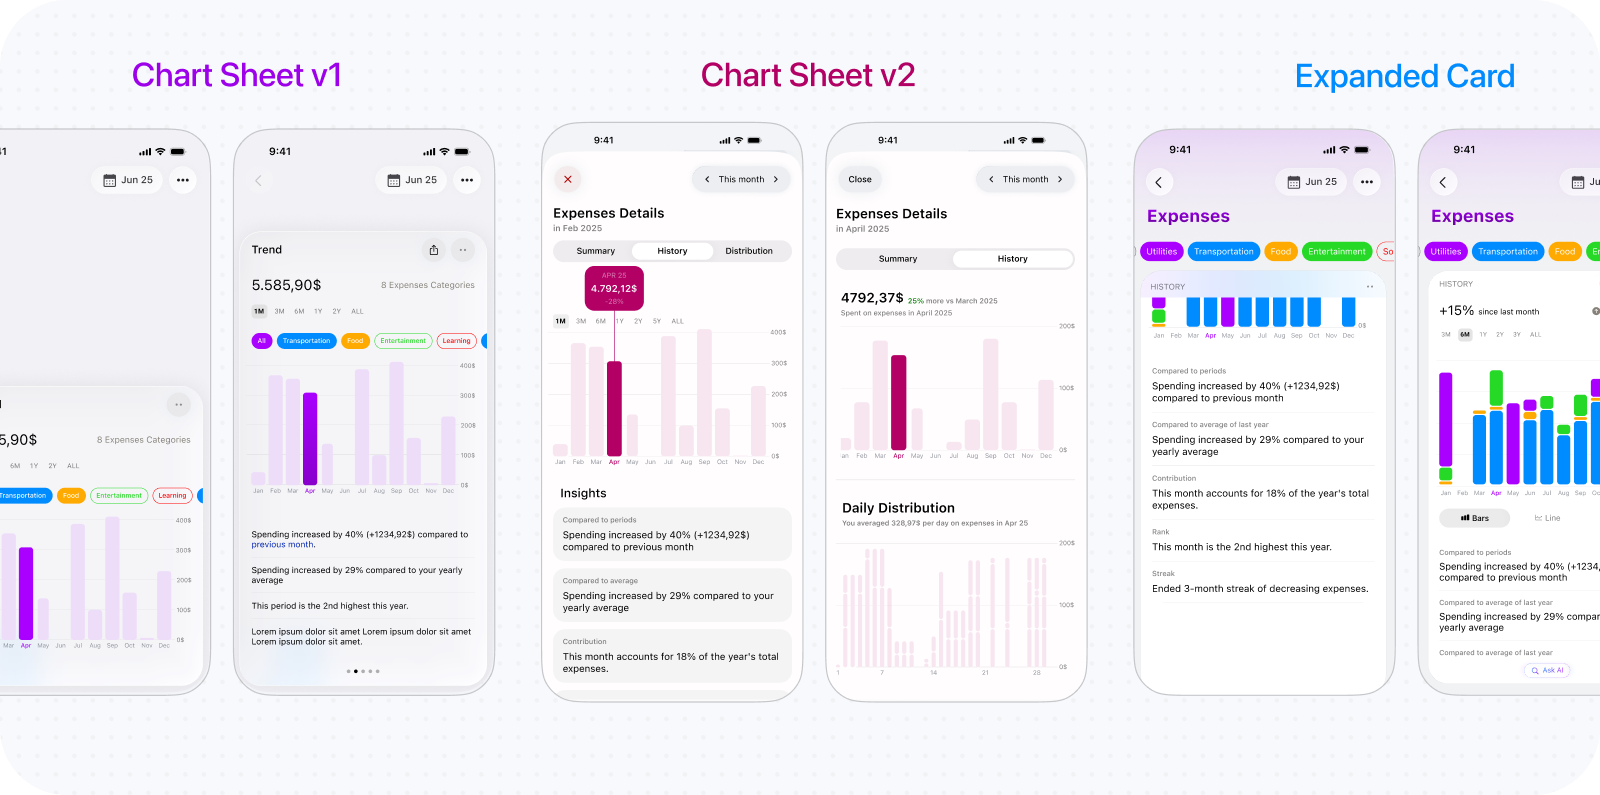
At one stage, selecting a chart opened a detailed Chart Sheet with a larger visualization, filters, comparisons, chart switching, and insights. It appeared to be a natural layer of progressive disclosure. In use, it became a second reporting system. Its controls overlapped with the cards and Period Picker, interrupted context, and received little use. I removed it and retained lightweight tooltips on the charts. I also removed Calendar and Statistics cards because neither answered a distinct enough question. Useful metrics moved into stronger cards. Report features now had to provide recurring understanding, not merely more capability.
Balancing report flexibility with interface simplicity
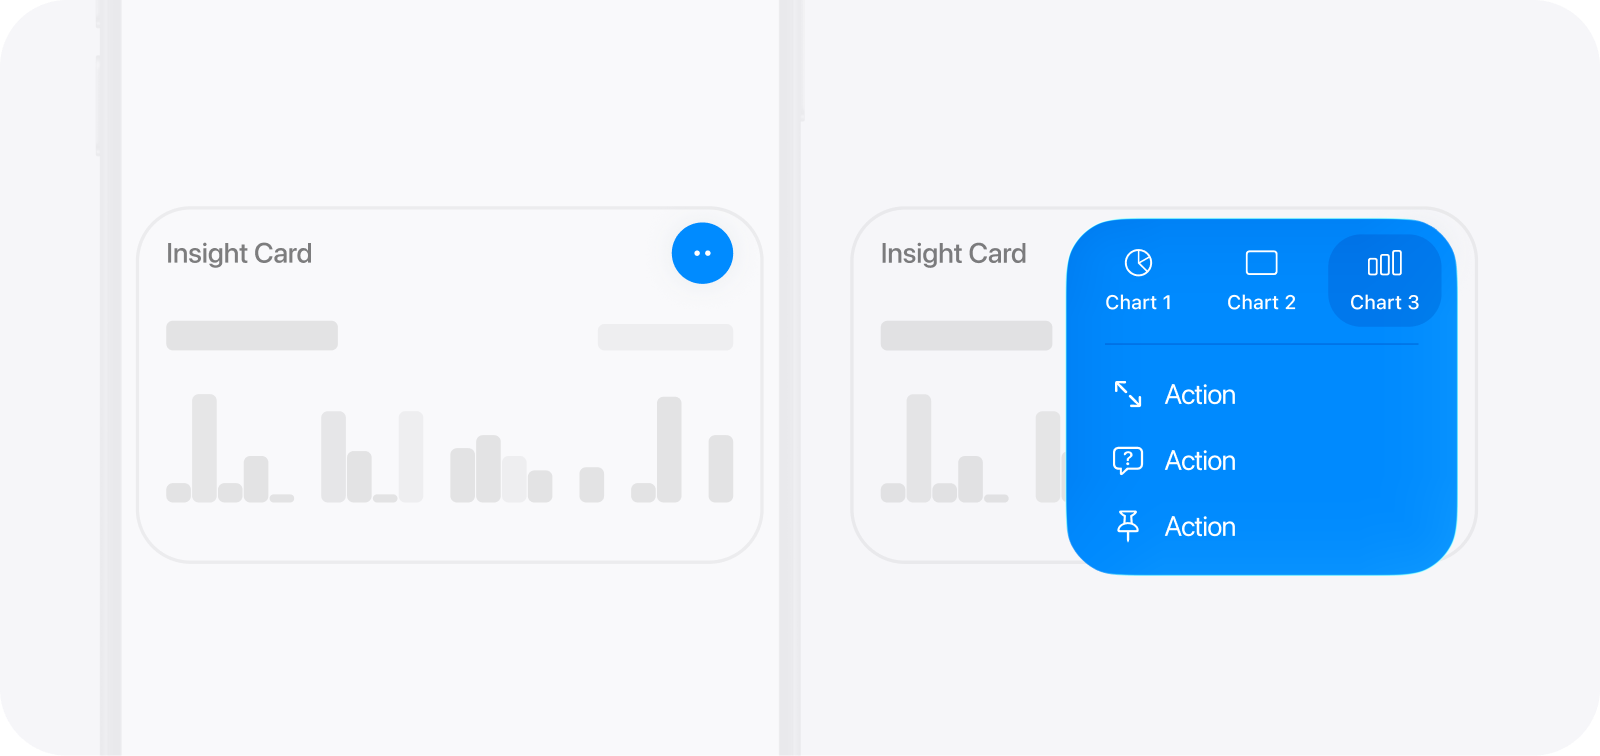
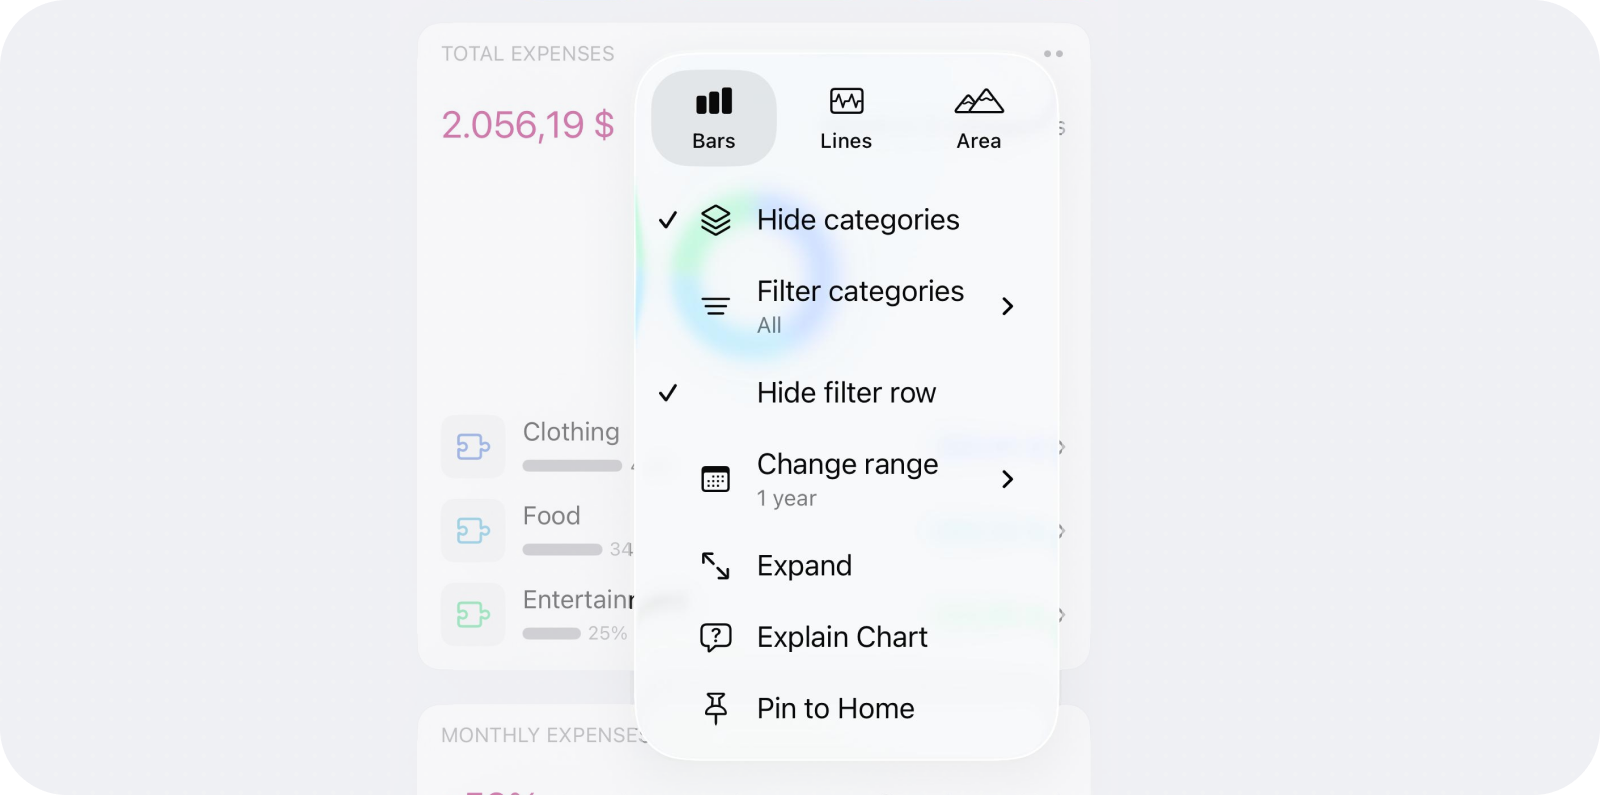
Segmented controls worked with two or three chart options but stopped scaling as cards gained category, range, calculation, and display settings. I moved secondary controls into menus. Long press looked cleaner but was difficult to discover and inefficient, so I replaced it with a quiet but visible two-dot trigger. Users can also hide, show, and rearrange cards. Their modular structure now supports Home summaries, PDF and image export, transaction export, and ongoing work on iOS widgets. Each surface adapts the system: Home prioritizes a glanceable conclusion, exports prioritize communication, and widgets introduce stricter space, refresh, privacy, and interaction constraints.
Category filtering initially opened a separate sheet of checkboxes from the menu. That added a detour for a frequent adjustment and hid which categories were included. Contextual chips brought the relevant categories into the report, making selection more immediate. The chips can also be hidden when filtering is not needed.
Integrating flexible period selection into reports
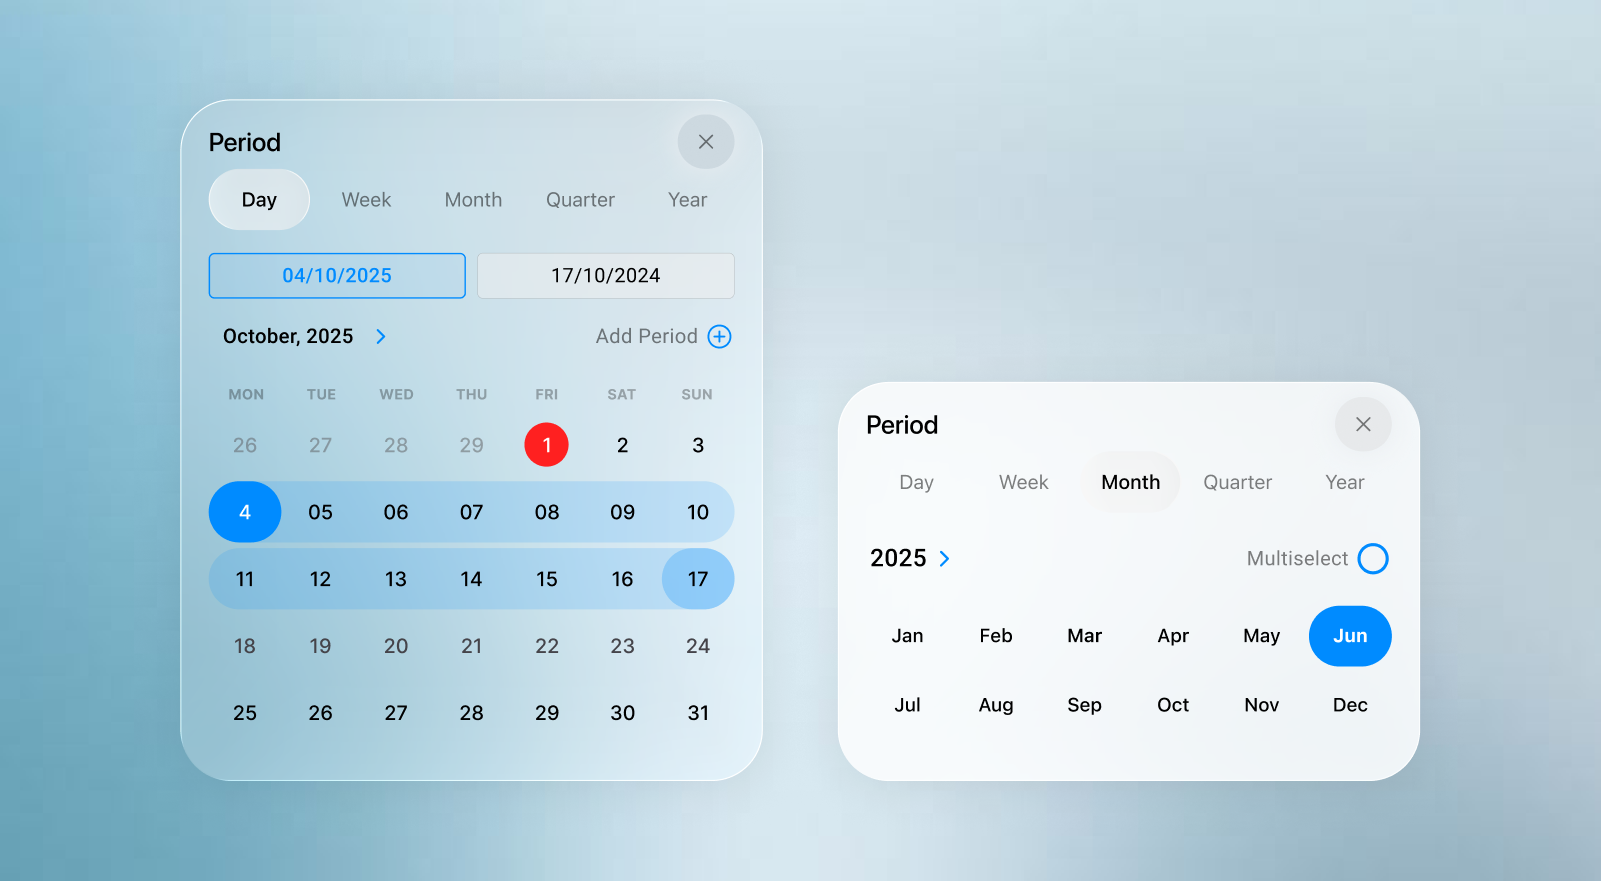
The same report can answer different questions depending on the selected period. A shared Period Picker supports switching between familiar intervals, custom ranges, and multiple periods without introducing separate time controls for every card. The Period Picker case study covers its interaction design and tradeoffs.
Separating cumulative and period-based reporting
Savings exposed an important ambiguity: how much is held now is not the same as how much was saved during a period. Balance, Investments, and Net Worth raised similar questions. Showing both modes throughout the interface added complexity, so period-based reporting became the default. For relevant categories, a cumulative balance note replaces the usual trend summary. An override remains in settings for advanced use, while selecting multiple periods allows their combined activity to be reviewed.
Design Engineering Budgets & Goals
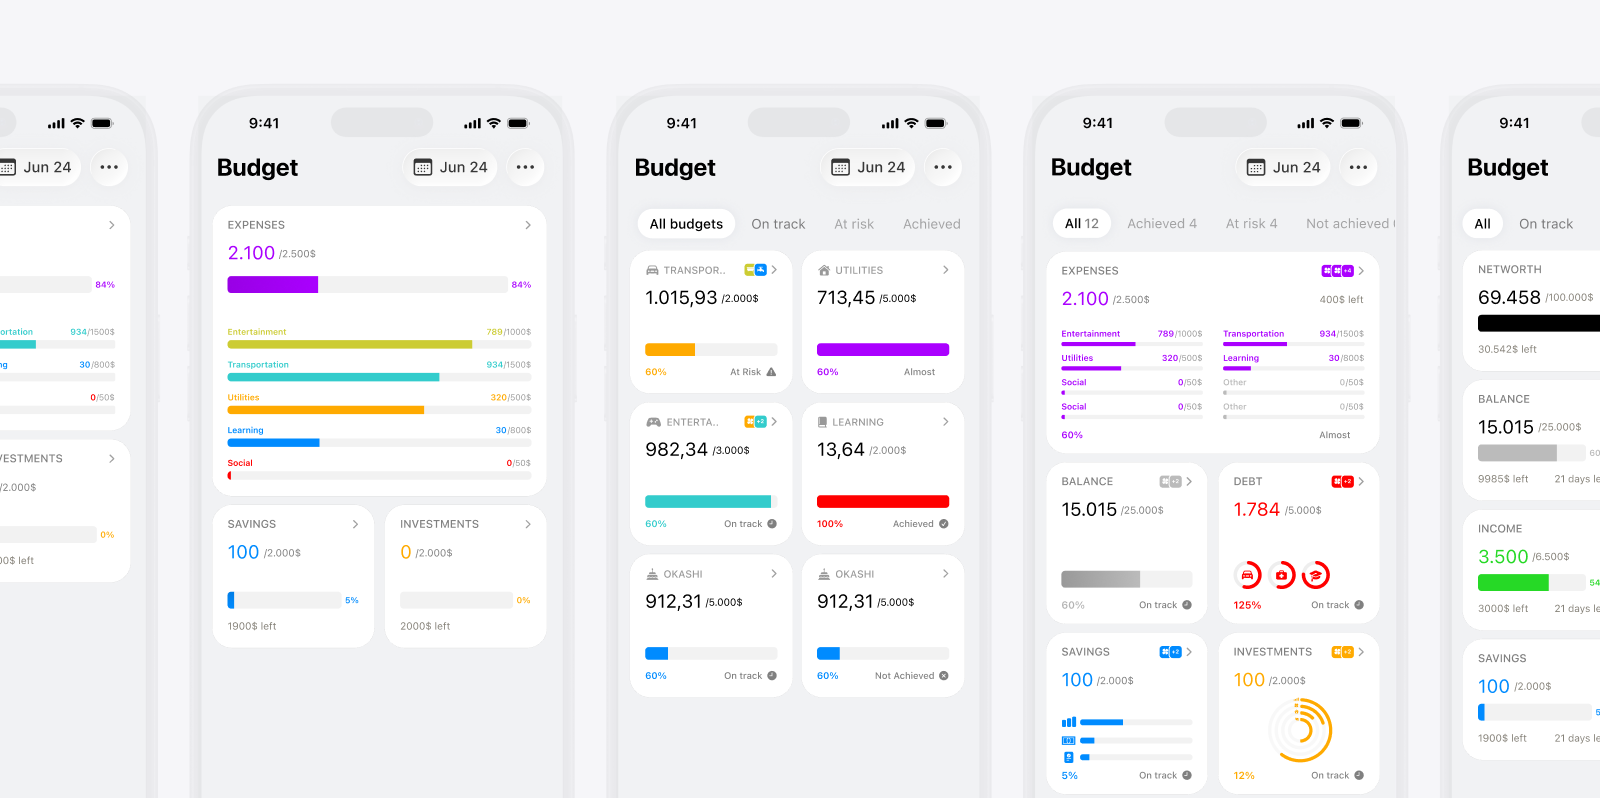
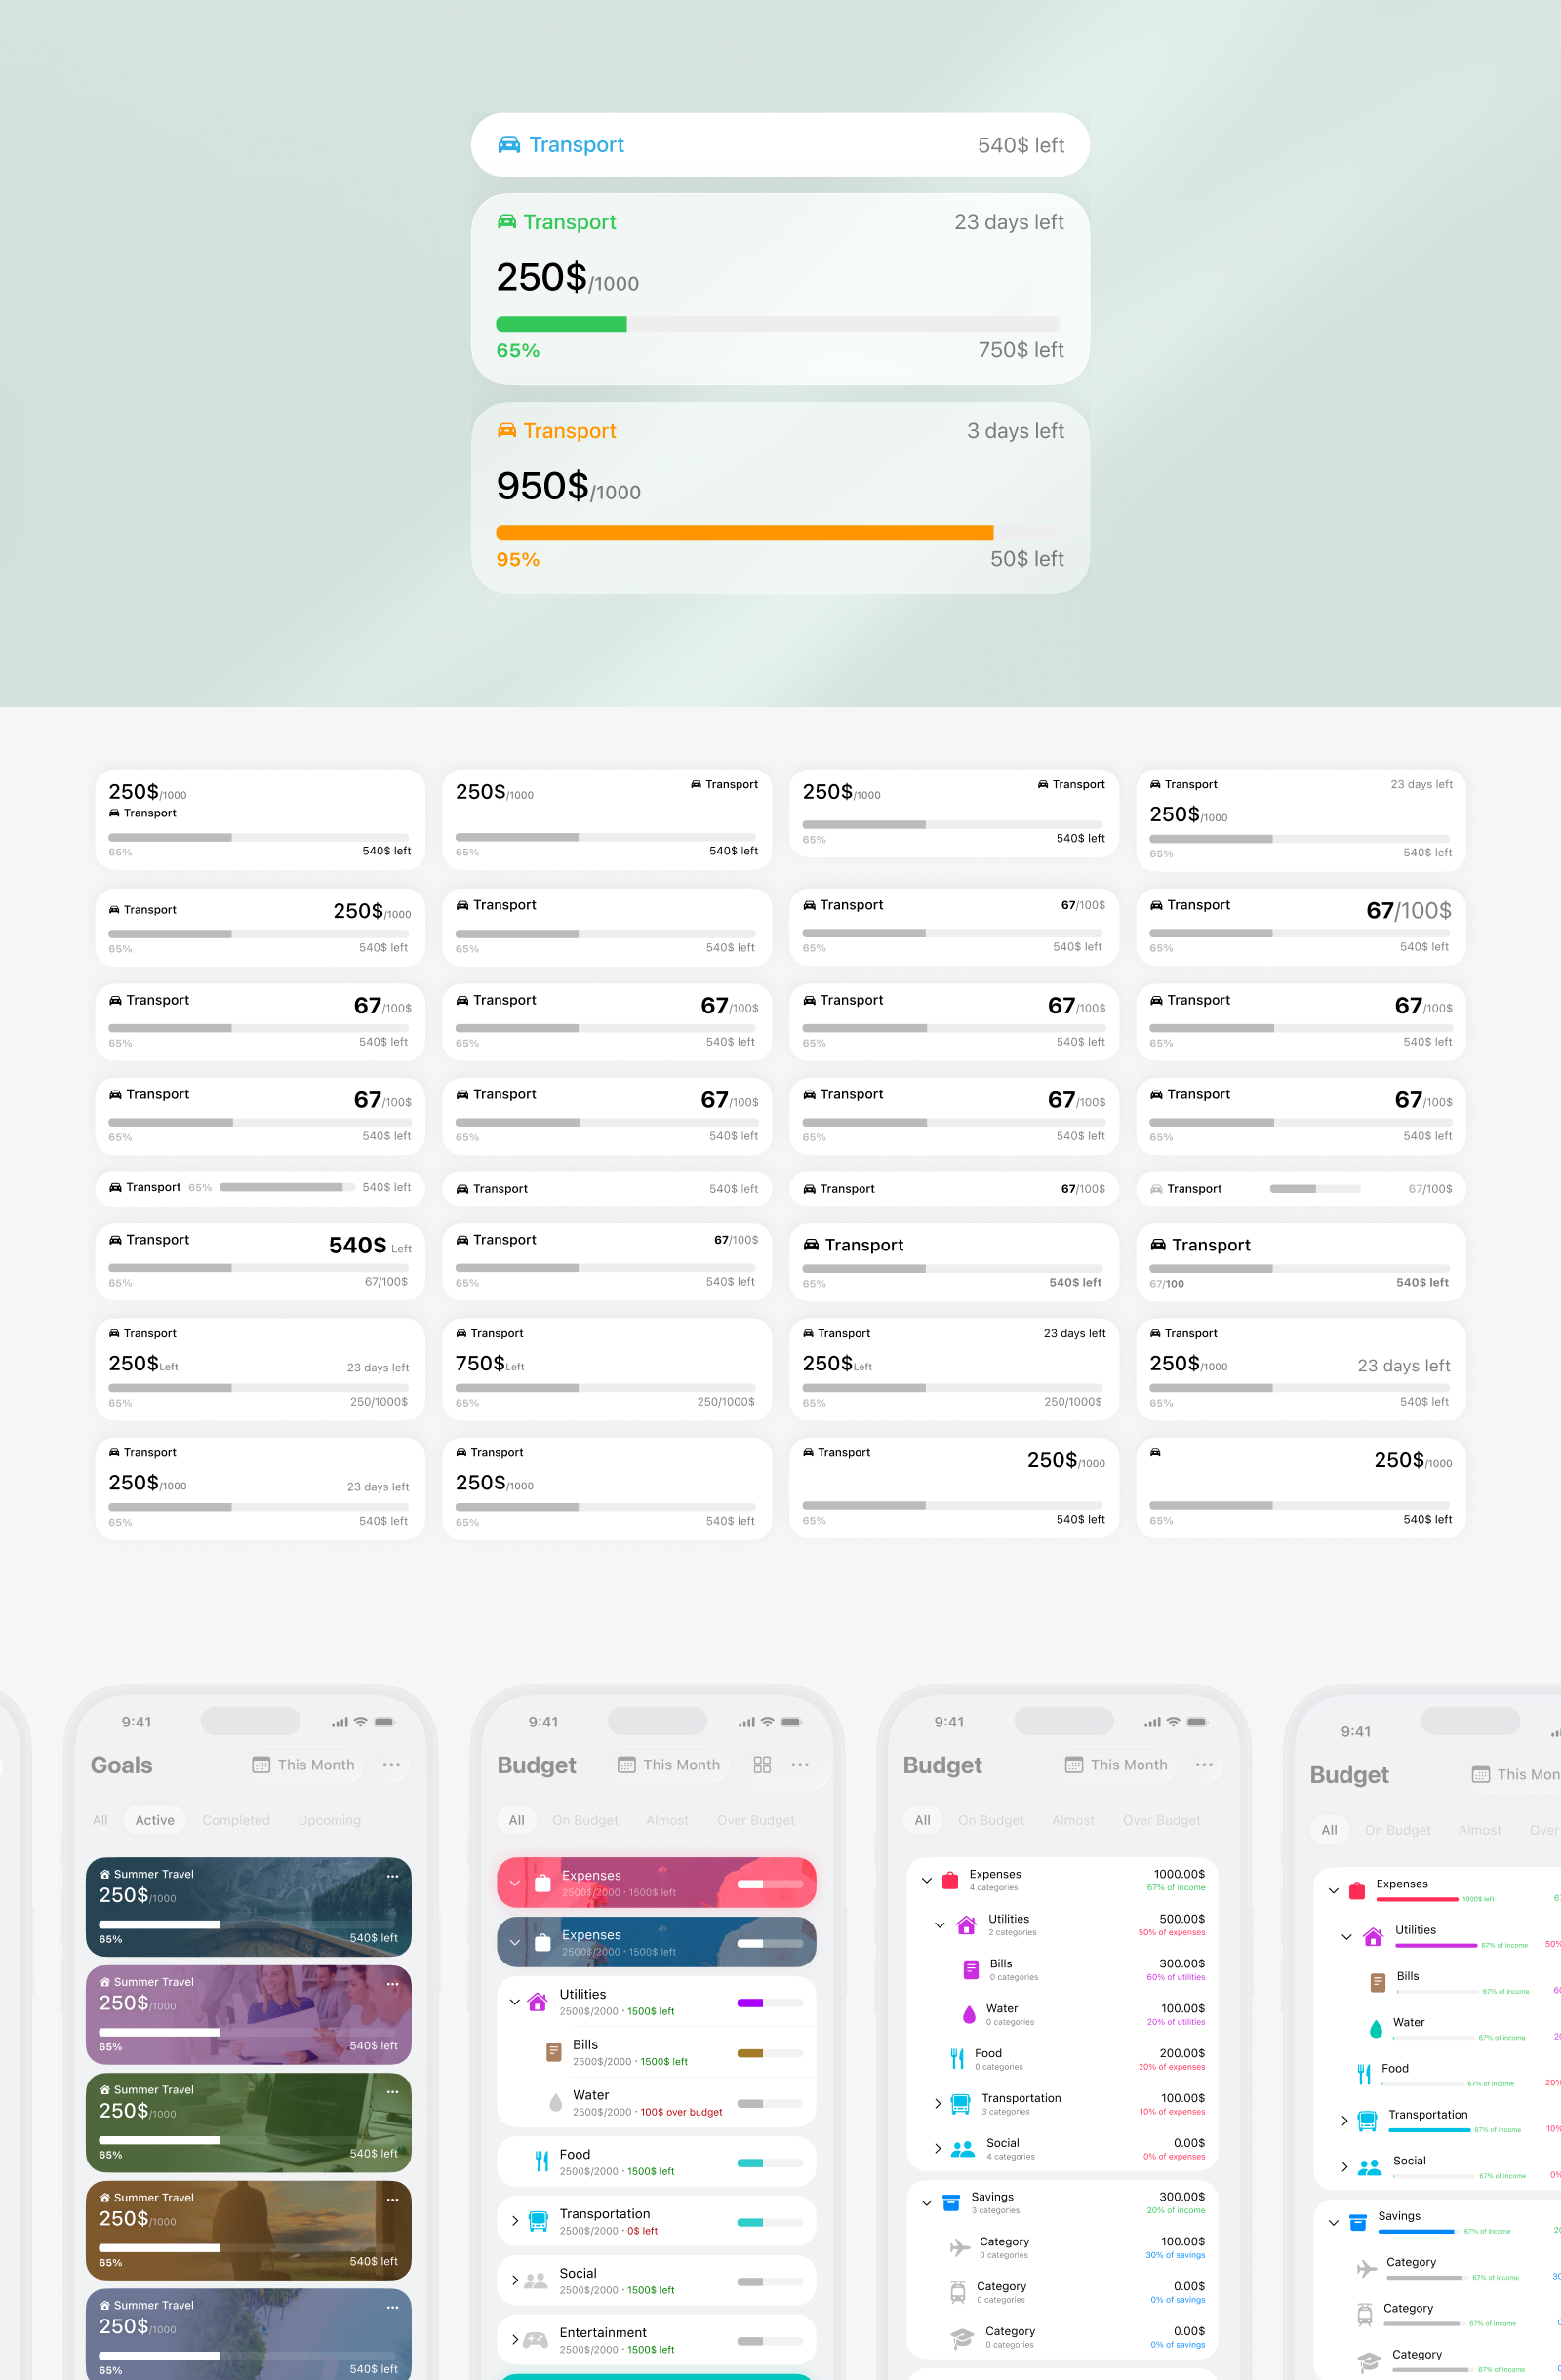
In Kane, setting up a budget is not about choosing a budgeting philosophy or learning budgeting rules. The user chooses a period, follows their own category hierarchy, enters amounts for the categories they want to plan, and skips the rest. The budget area then brings those choices together so they can see progress, move between periods, and edit a plan when it changes. That sounds straightforward, but it took several iterations to decide what a budget meant, how it related to time and goals, and how to make setup and review work across potential large category trees.
Adapting budgets to how users organize their finances
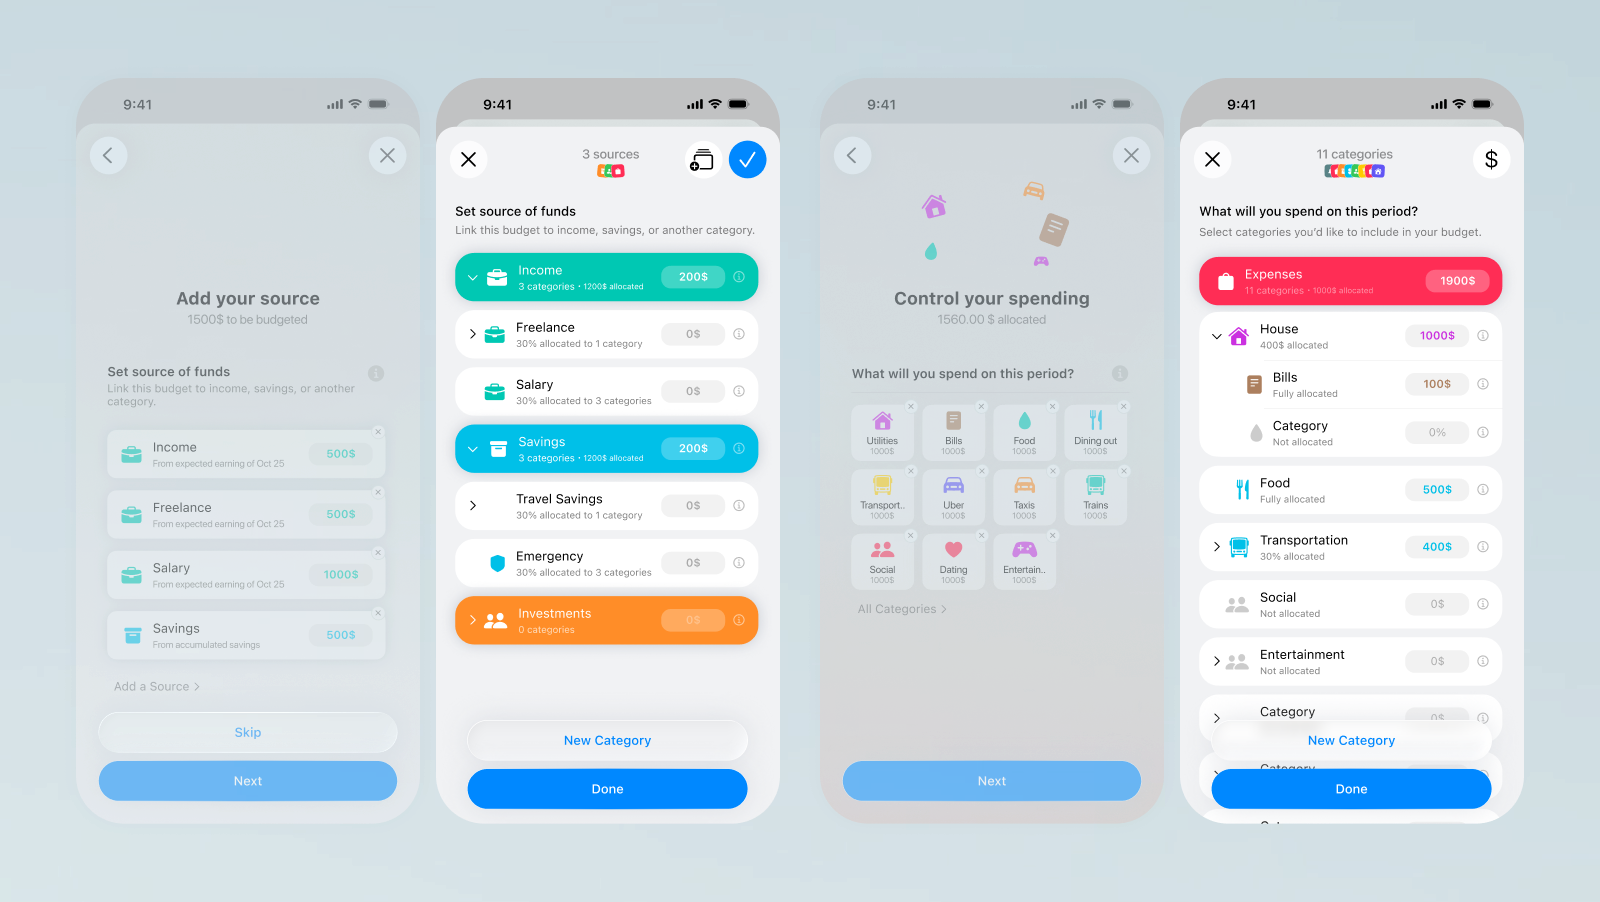
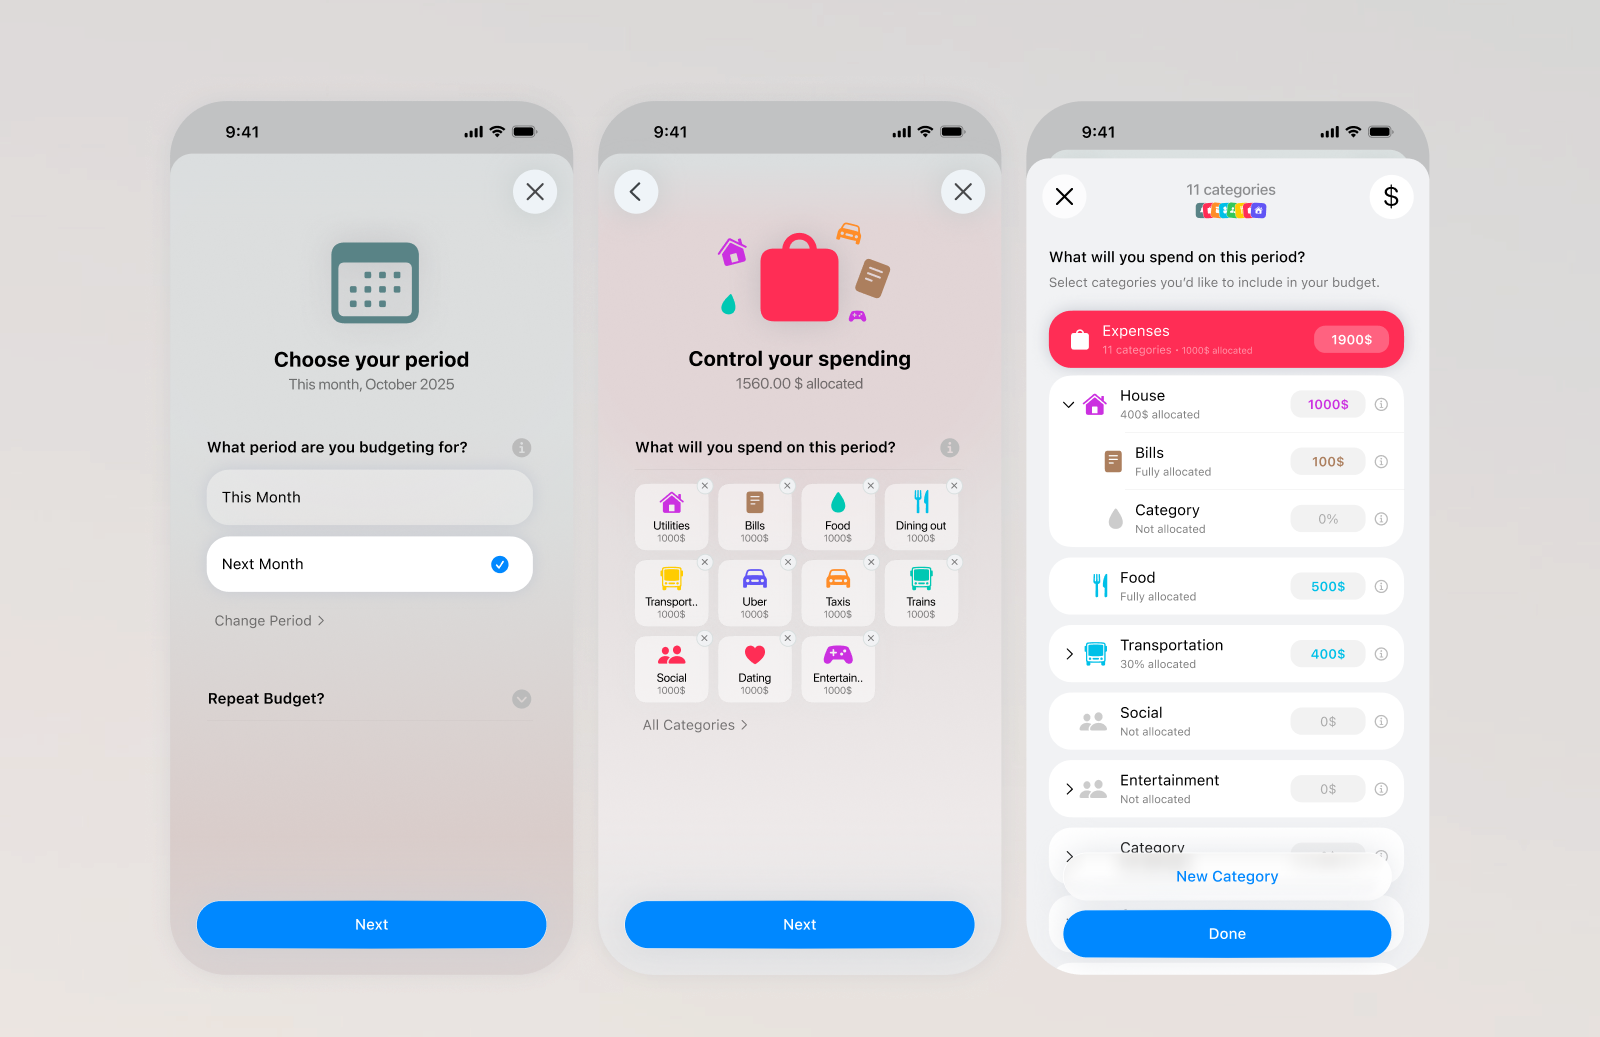
I explored different ways to think about a budget, including envelope-like systems, broad totals, and separate limits for categories. The useful direction was to make the user’s existing category structure the place where they build their plan. The category picker follows the same hierarchy used elsewhere in Kane, so people can work at the level that makes sense to them instead of adopting a fixed budget taxonomy. During setup, each category can receive a value or be skipped. Users do not need to create a budget for every category, and the interface does not ask them to learn internal rules about whether a category should be “under” or “over” a target. Kane interprets the category and target appropriately behind the scenes; the interaction stays focused on choosing where to plan and entering the amount. This keeps budgeting connected to category management and reporting. If a person changes how they organize their finances, the plan can follow that same structure.
Replacing repeated budget forms with a guided multi-step wizard
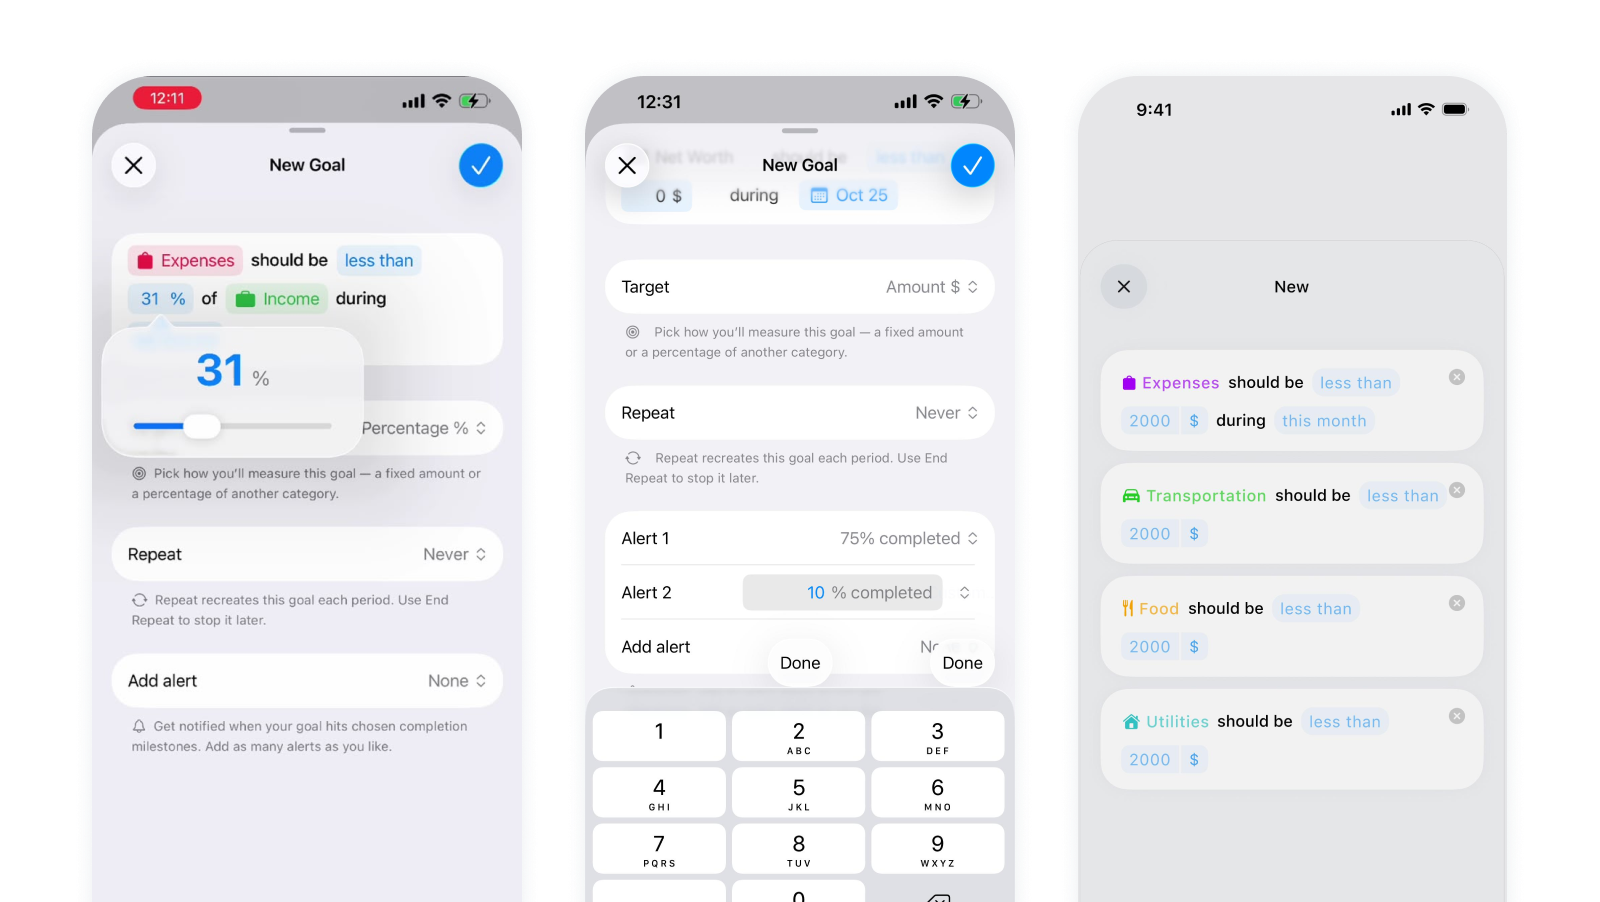
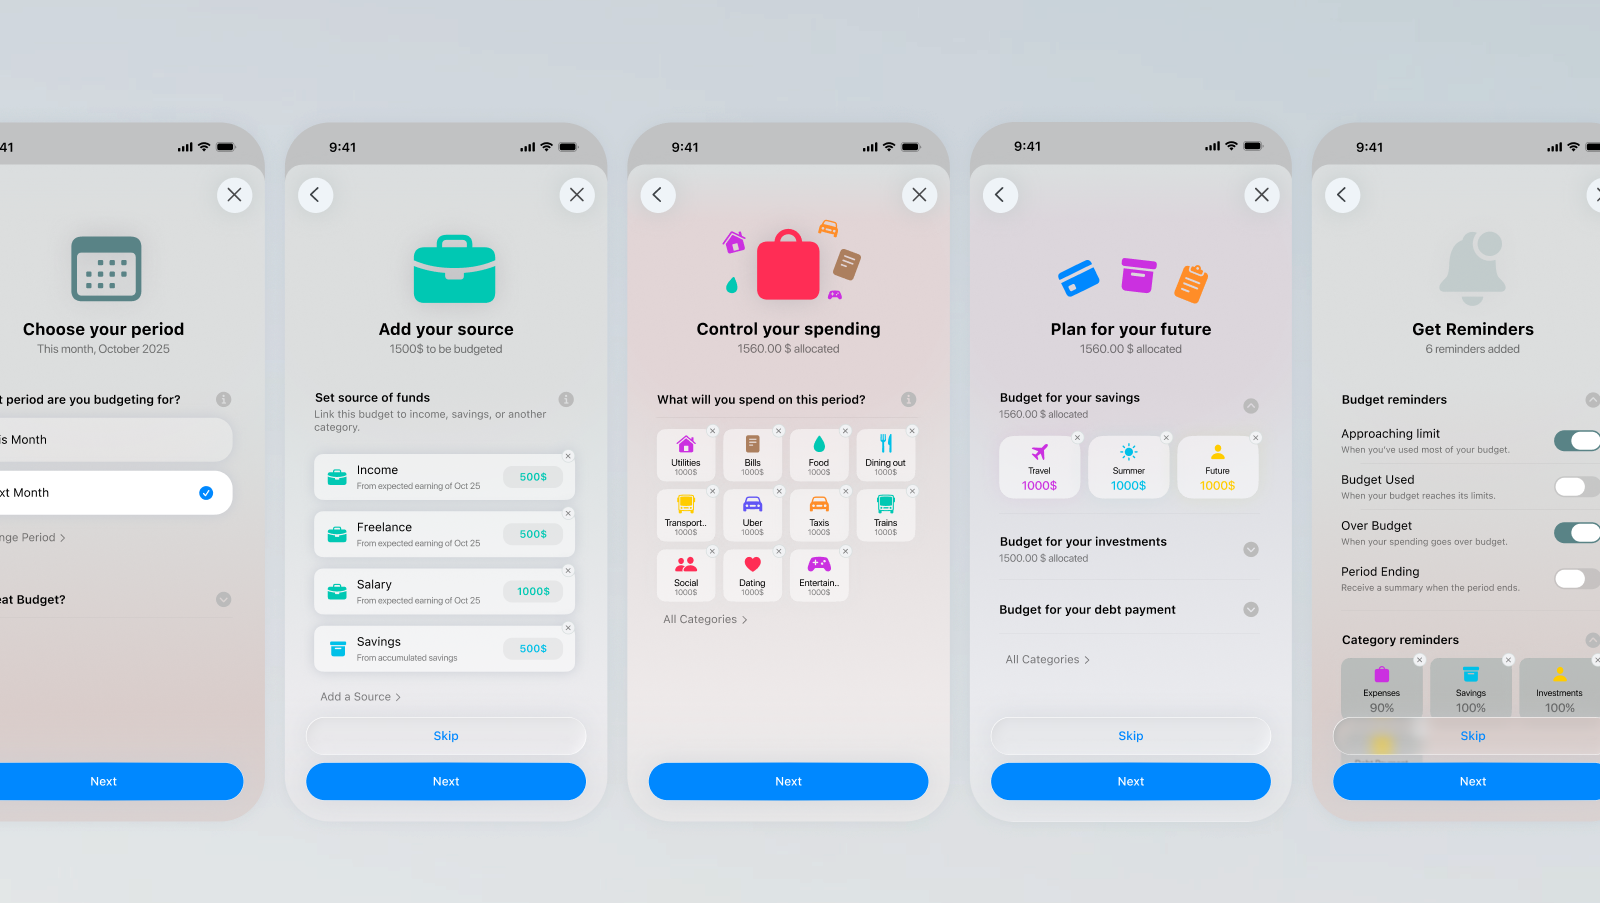
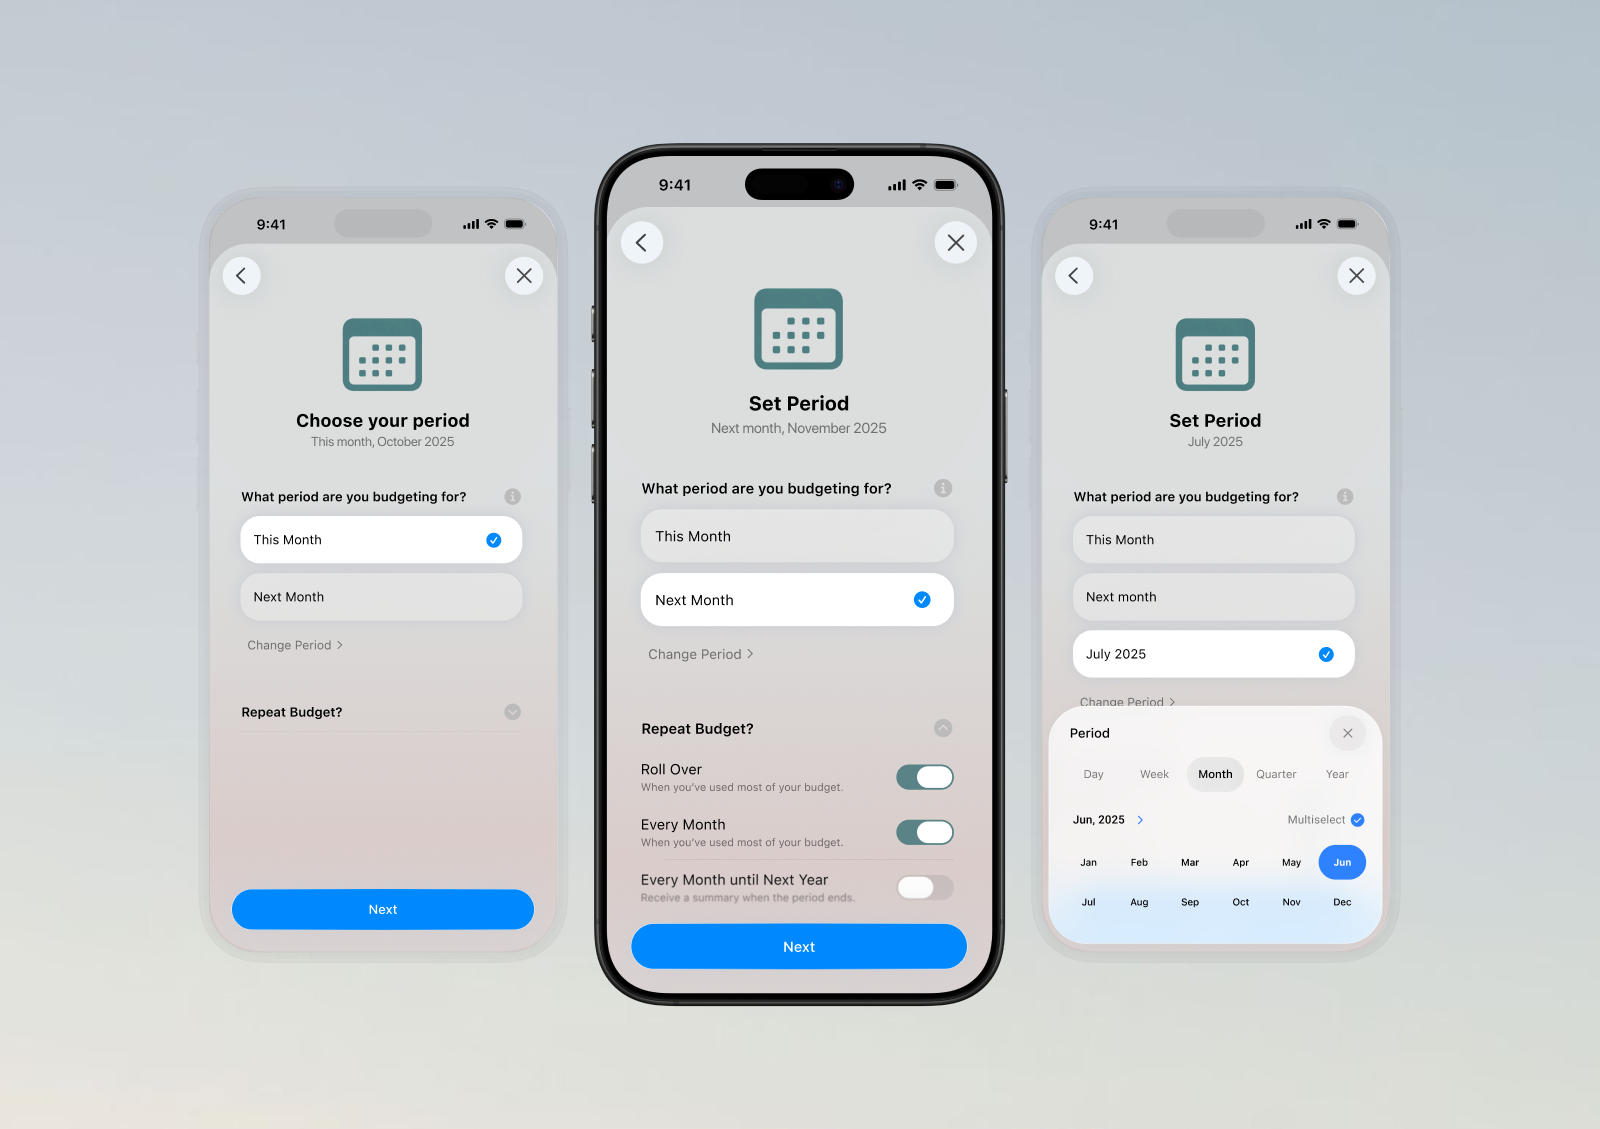
The standard sheet was inefficient for a task that could involve many categories: create a budget, choose one category, enter a value, save, then repeat. I moved toward a dedicated, guided setup so a user can build the period’s plan across categories in one continuous flow. The Figma iterations explore the decisions that belong in that flow: choose a period, identify funding sources, set category amounts, plan for savings or other future priorities, and optionally choose reminders. The latest iteration narrows setup to expense planning, removes income configuration, and uses reminder defaults. Some versions show category selection and amount entry together, including percentage-based values and historical spending as reference. The purpose of the wizard is not to add steps for their own sake; it is to make a multi-category task feel coherent and manageable. Editing one existing budget can stay focused on that specific item rather than rerunning full setup.
Replacing budget drill-downs with a unified list
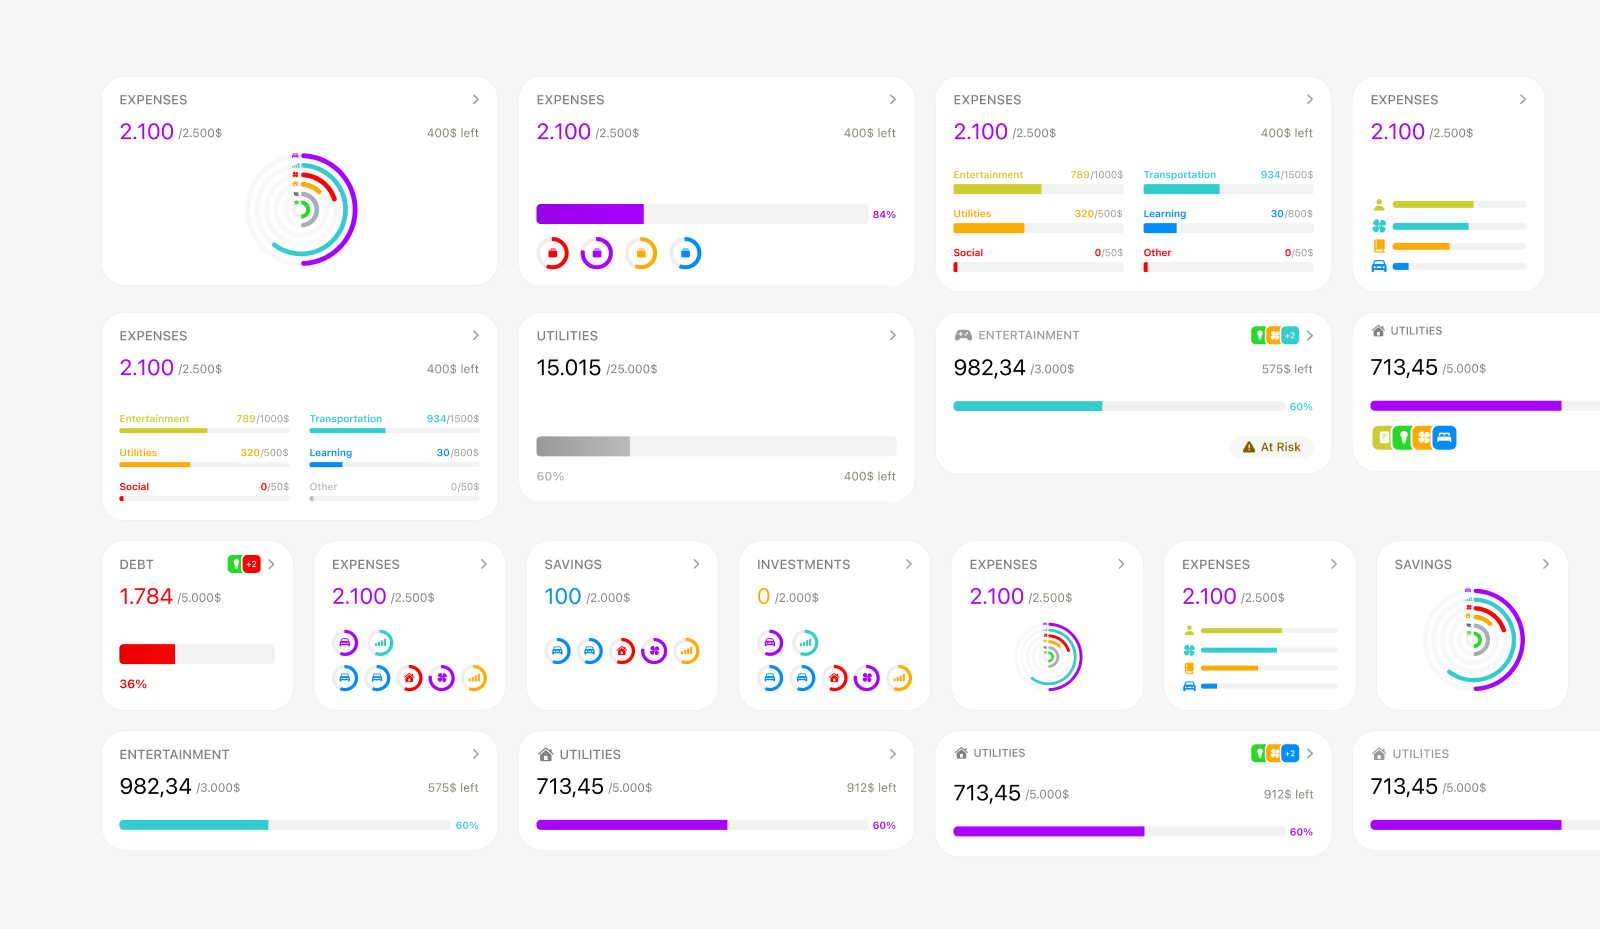
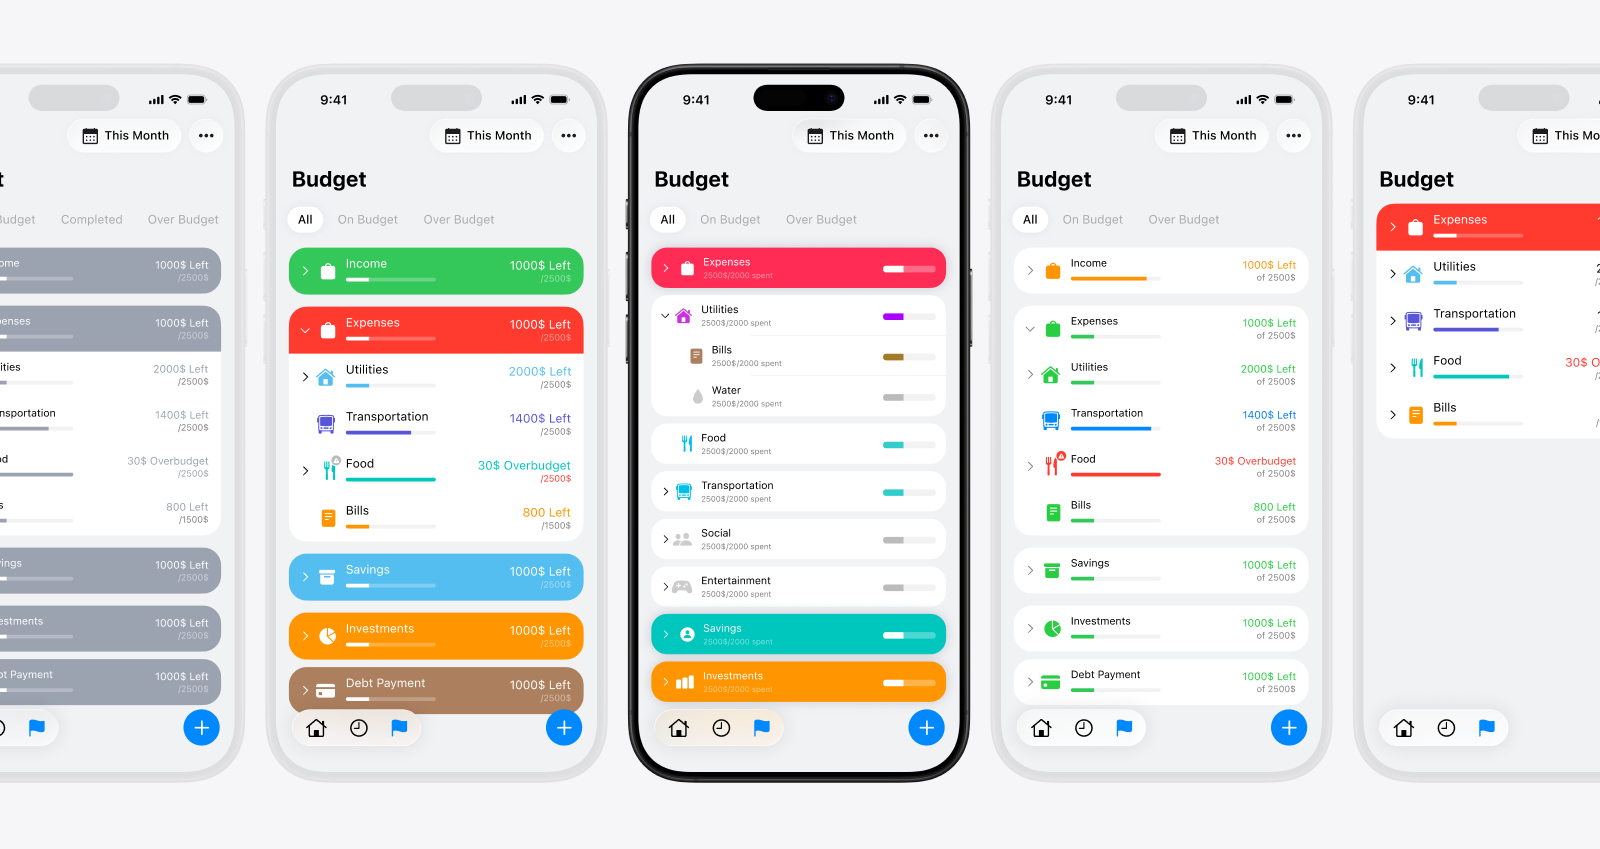
An early direction reused the report pattern: show square cards for high-level categories and navigate into their sub-budgets. It fit Kane’s existing navigation, but made the user move between screens to understand the plan as a whole. With many categories, it was hard to compare progress or notice which areas needed attention. The later direction brings the budgets the user has created into one clear list for the selected period. The Figma boards compare grids, full-width rows, progress bars, percentages, and status labels. The design goal is to show enough to understand each category’s progress without turning the overview into a dense spreadsheet. Opening a category gives more detail and an edit path; the overview remains for scanning the plan across categories. This separates two jobs that had been tangled together: creating or changing a budget, and monitoring the budgets already in place. It also gives the user a direct way to move from the overall picture to one category when something needs attention.
Connecting flexible periods with recurring budgets
A monthly-only model would have simplified the interface, but Kane already supports thinking in weeks, quarters, years, and custom periods. I considered whether to create separate budgets for each cadence, or to make monthly budgets the base and accumulate them into longer periods. Each approach creates questions: which plan should appear for a selected period, what should an empty period show, and how can someone review or change a past plan without changing what they originally set? The current model separates a recurring budget template from a concrete instance for a specific period. The user can review periods before or after the current one, while each period retains its own resolved target. The setup designs also explore optional repeat and rollover behavior. Recurrence and period navigation are supported in the product model; rollover and mixed-cadence rules remain exploratory. Using Kane’s period language keeps budget review connected to reporting, but it also makes the empty, past, and future states important parts of the experience, not edge cases. The user should be able to tell whether they are viewing an existing plan, a repeated plan, or a period with no budget configured.
Separating budget management from goal tracking
Budgets and goals were easy to conflate because both have categories, targets, periods, and progress. Their purpose is different: budgets help someone plan and monitor categories for a chosen period; a goal represents an outcome they want to reach, such as saving for a trip. The designs begin to express that distinction visually. Budgets use a practical list of category amounts and progress. Goals explore more expressive named cards, imagery, and states such as Active, Completed, and Upcoming. This gives each concept a clearer job without requiring every piece of planning logic to be duplicated. The distinction is not yet clean in the implementation: Goals and budgets still share much of the same data model and creation flow. That reuse keeps target and recurrence mechanics together, but the user-facing labels and entry points still need to make clear whether someone is setting a period budget or tracking a longer-term outcome.
Design Engineering Transaction Flows
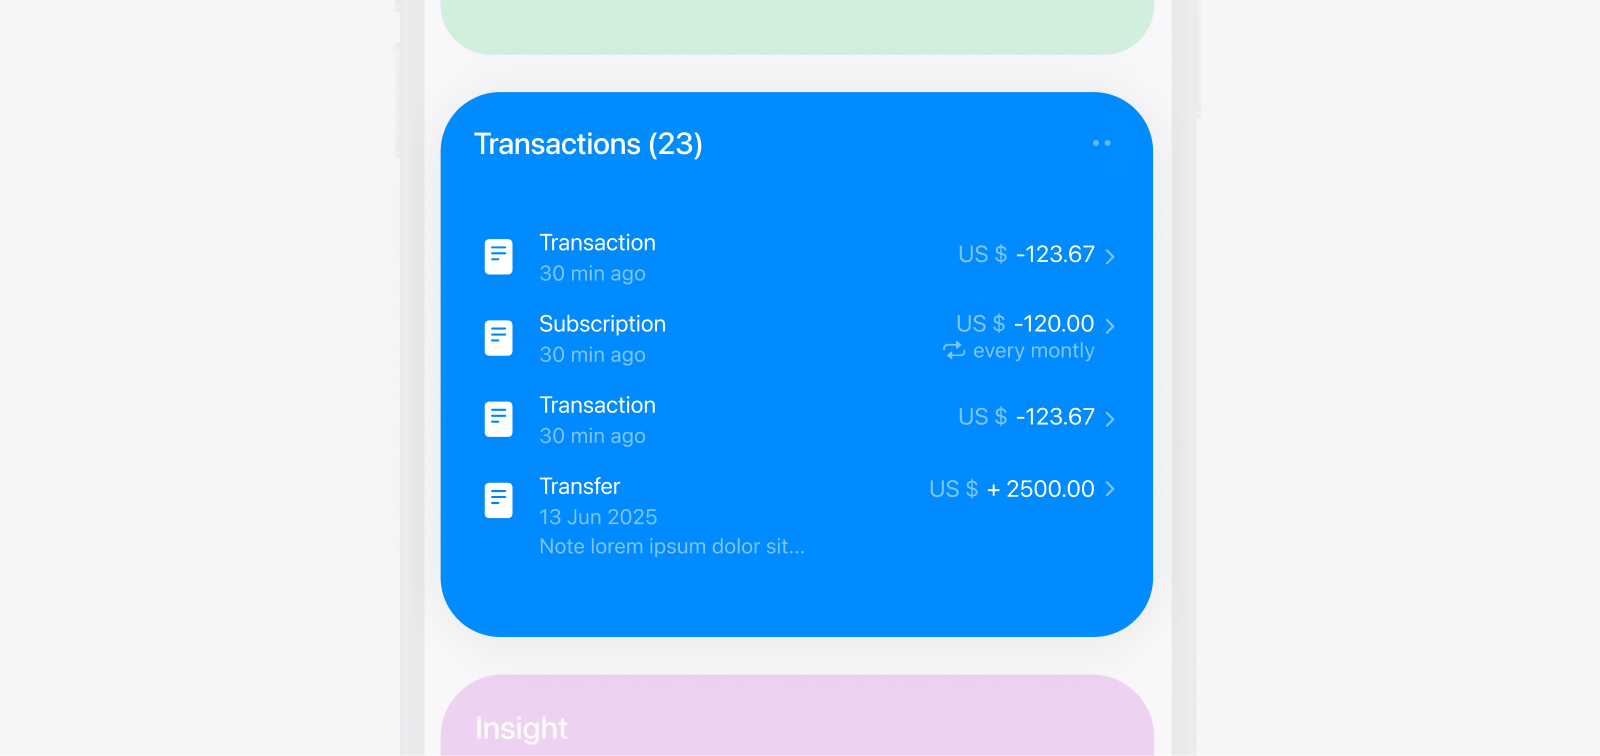
Transactions sit between almost every part of Kane. They are created through the logging flow, organized through categories, summarized in reports, and reopened when a result needs explanation. This meant that changing the transaction model affected the list, row design, filters, details, editing, and report calculations at the same time. The final direction prioritizes common transactions while progressively disclosing additional control. Transactions appear inside the category reports they explain, logging is divided into three focused steps, and viewing and editing reuse the same contextual sheet. More advanced concepts such as recurrence, splitting, projections, and financial sources remain available, although some may be reduced for a broader public product.
Each addition had to be considered across the system, not only in the screen where it originated. A new transaction property could require changes to logging, editing, list rows, filters, and report calculations. That wider cost became part of deciding whether a feature deserved a place in the model.
Integrating transactions into category reports
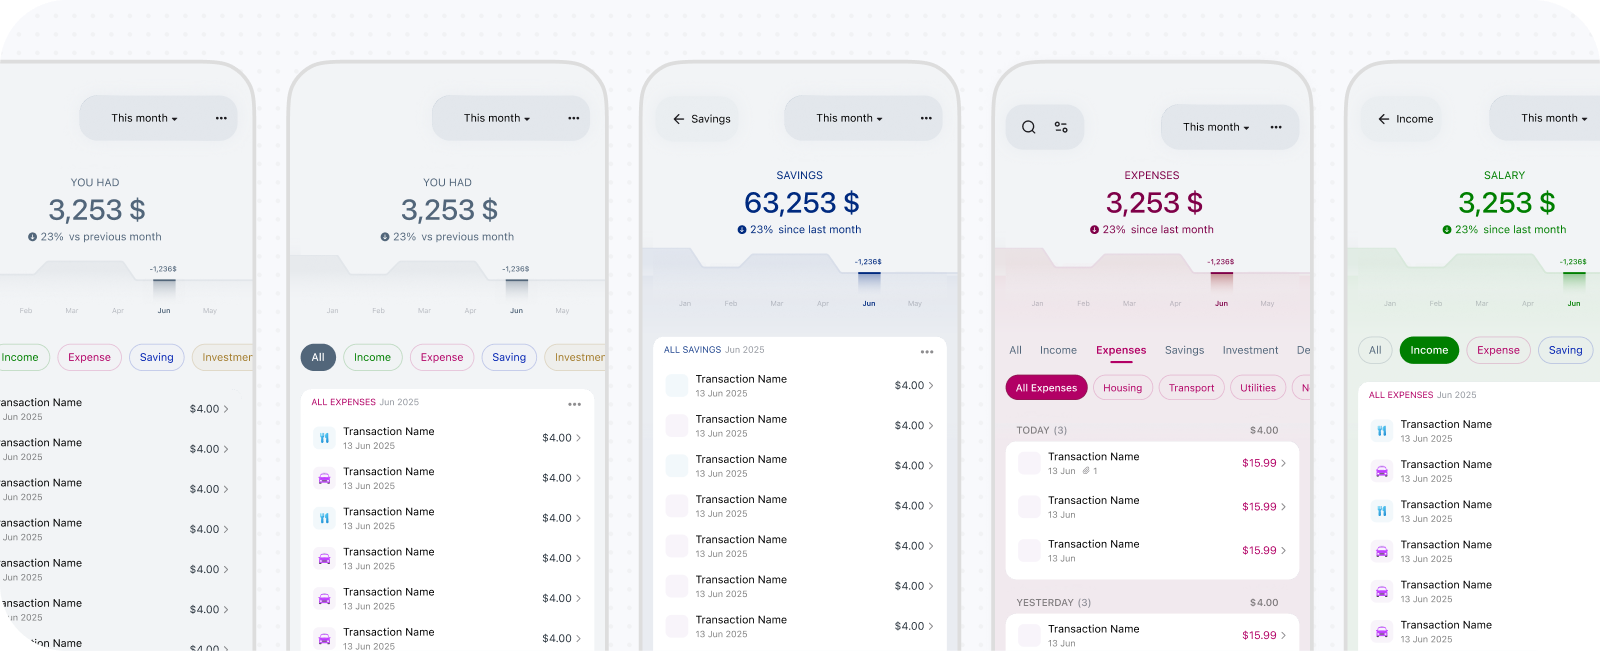
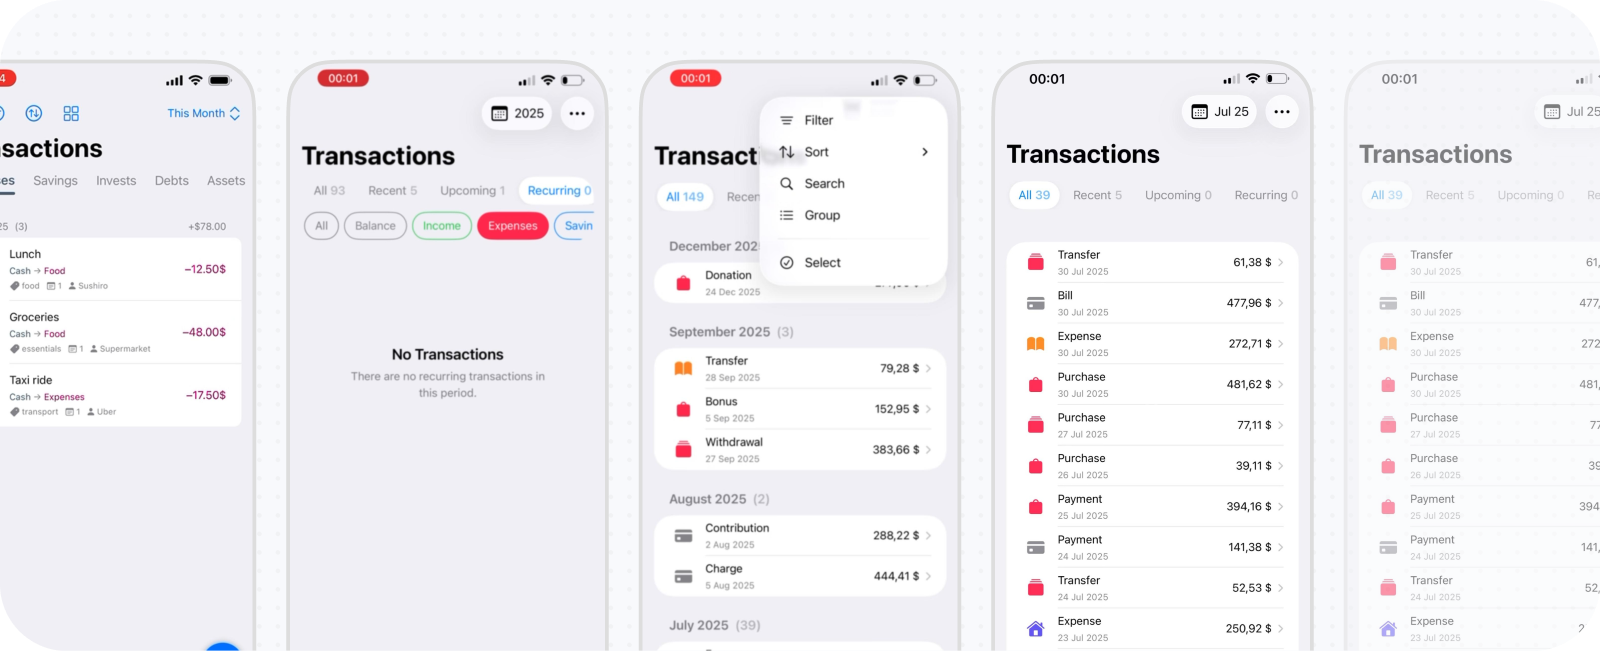
The original architecture used a dedicated Transactions screen with filters. I added top-level category tabs for faster movement, then subtabs for the next level. Kane’s categories could be nested indefinitely, however, while tabs could not. Keeping only the first levels visible made the structure easier to use but broke the logic of the hierarchy. The larger problem was how transactions were actually reached. I usually opened Kane to review reports, then wanted the underlying records only after noticing something unusual. Even when the Transactions screen inherited the previous report’s filters, leaving the report and entering another destination remained inefficient.
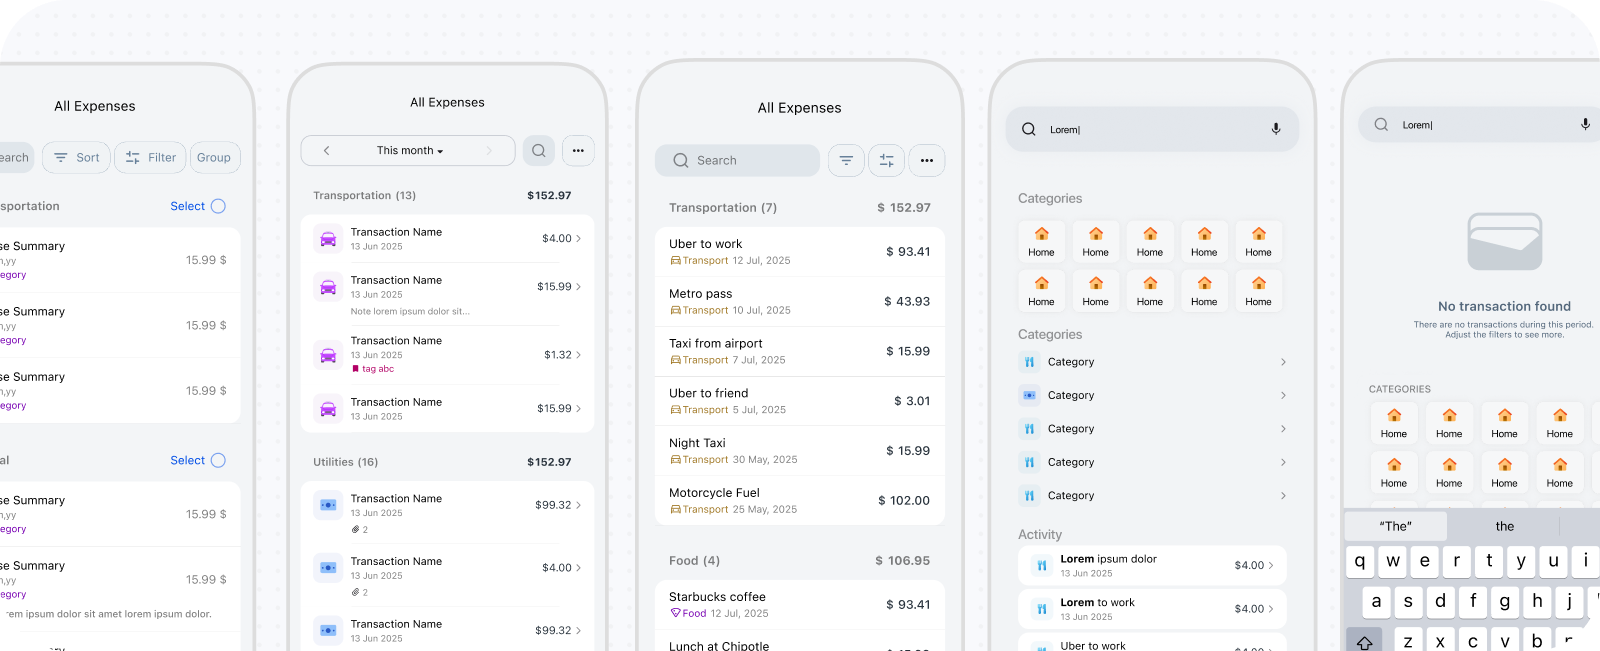
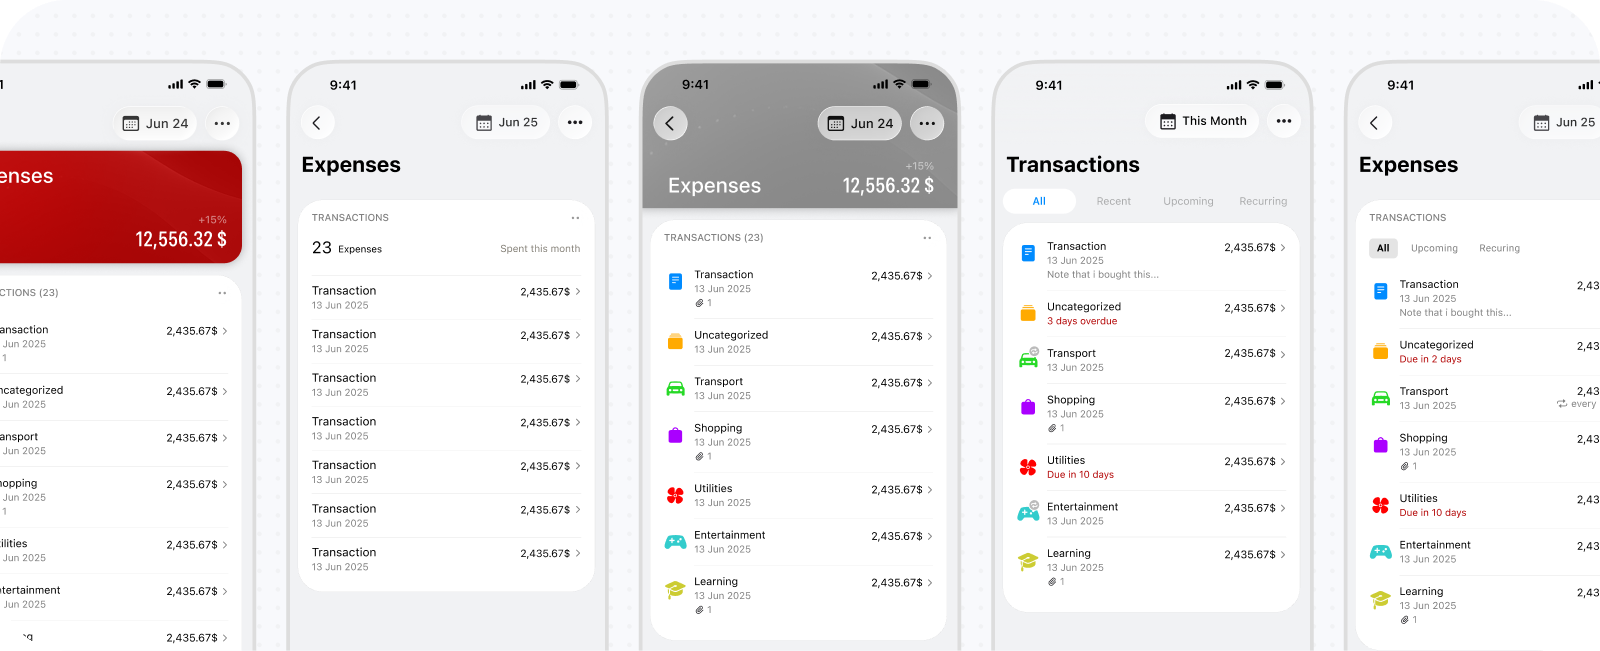
I added a small Transactions card to each category report. It initially acted as a shortcut, then expanded into a sheet with the capabilities of the original screen: search, sorting, selection, editing, recategorization, and chips for the current category’s immediate children. As I relied increasingly on this contextual version, I removed the standalone Transactions screen. The result aligns the list with Kane’s recursive reporting architecture. A report for Restaurants reveals restaurant transactions; Expenses reveals all expense descendants; Balance can expose the broader financial record. The main tradeoff is losing one obvious archive for every transaction. I tested global access from Home and its menu, but neither justified the additional interface weight.
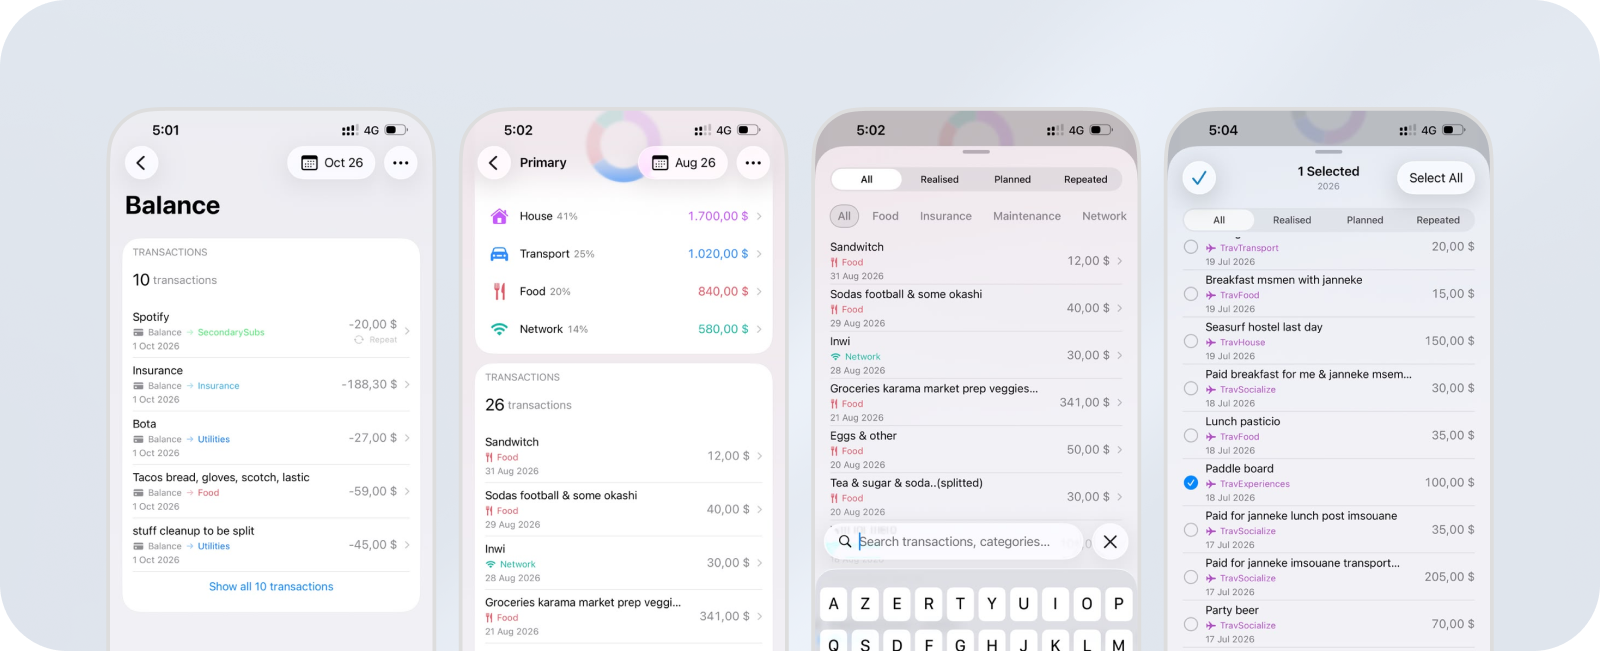
The earlier transaction overview repeated a familiar pattern: a headline total above the records. Once transactions moved into category reports, that summary was already available in the surrounding context. The list could focus on finding and inspecting records instead of maintaining another financial overview.
Supporting recurring, split, and planned transactions
Kane initially supported one ordinary transaction. Real use introduced three additional concepts: recurring transactions, splits across time, and planned or projected transactions. Each solved a real problem but expanded creation, editing, rows, filters, details, and reporting. Recurring transactions became necessary for activity that repeats predictably. They introduced schedules, future occurrences, active and paused states, and the distinction between editing one transaction and changing a series.
Splitting addressed purchases whose cost was consumed across several months. Assigning the full amount to the purchase month distorted the insight I wanted, so Kane could distribute its reporting effect across dates. Planned transactions similarly separated foreseeable future activity from what had already happened. Previously, I logged them with future dates, but current-month reports then combined completed and future transactions without explaining the difference. These features added transaction-state controls and actual-versus-projected reporting modes. They also challenged Kane’s goal of feeling intuitive. Recurrence is likely broadly useful; temporal splitting and projections are more personal power features whose value may not justify their complexity for most users. A public version would likely remove or simplify them unless research demonstrated a wider need.
Separating core details from optional metadata
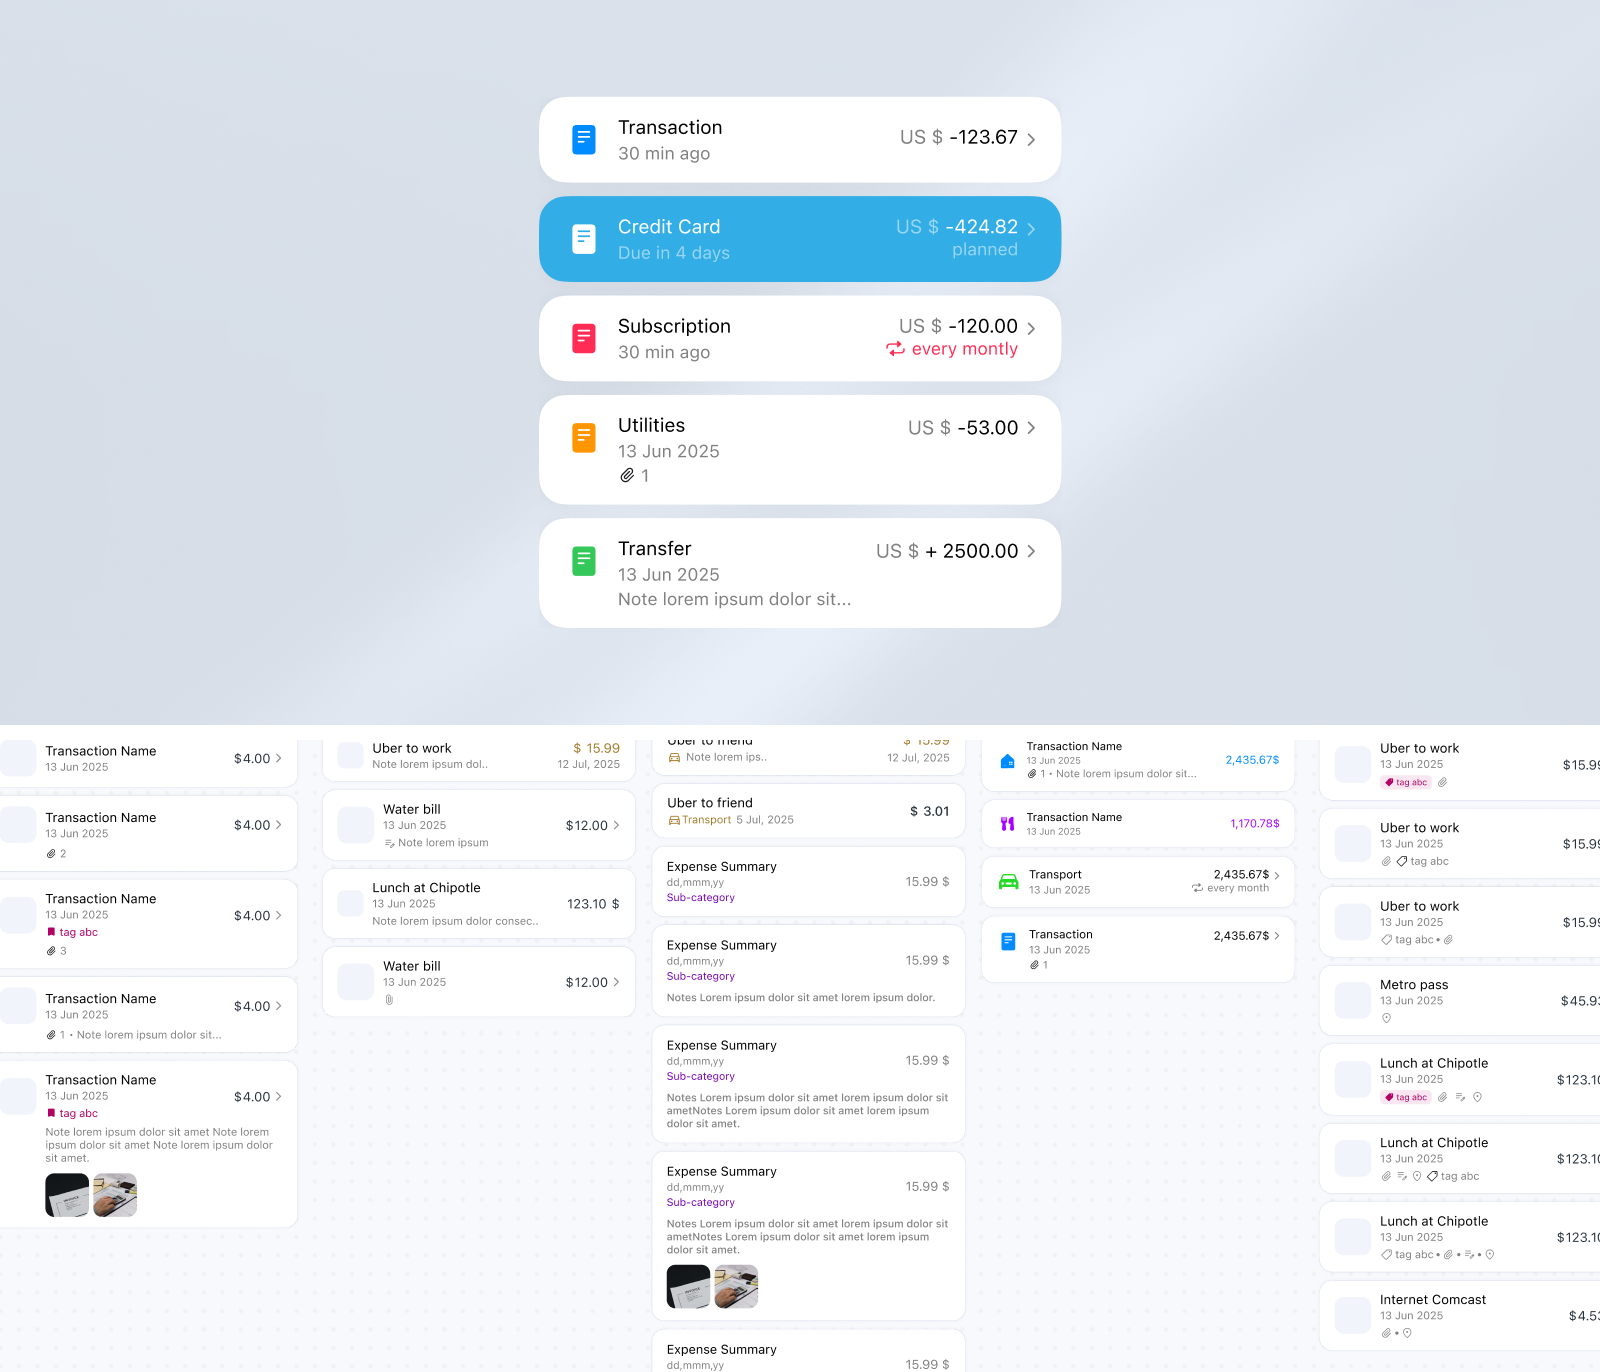
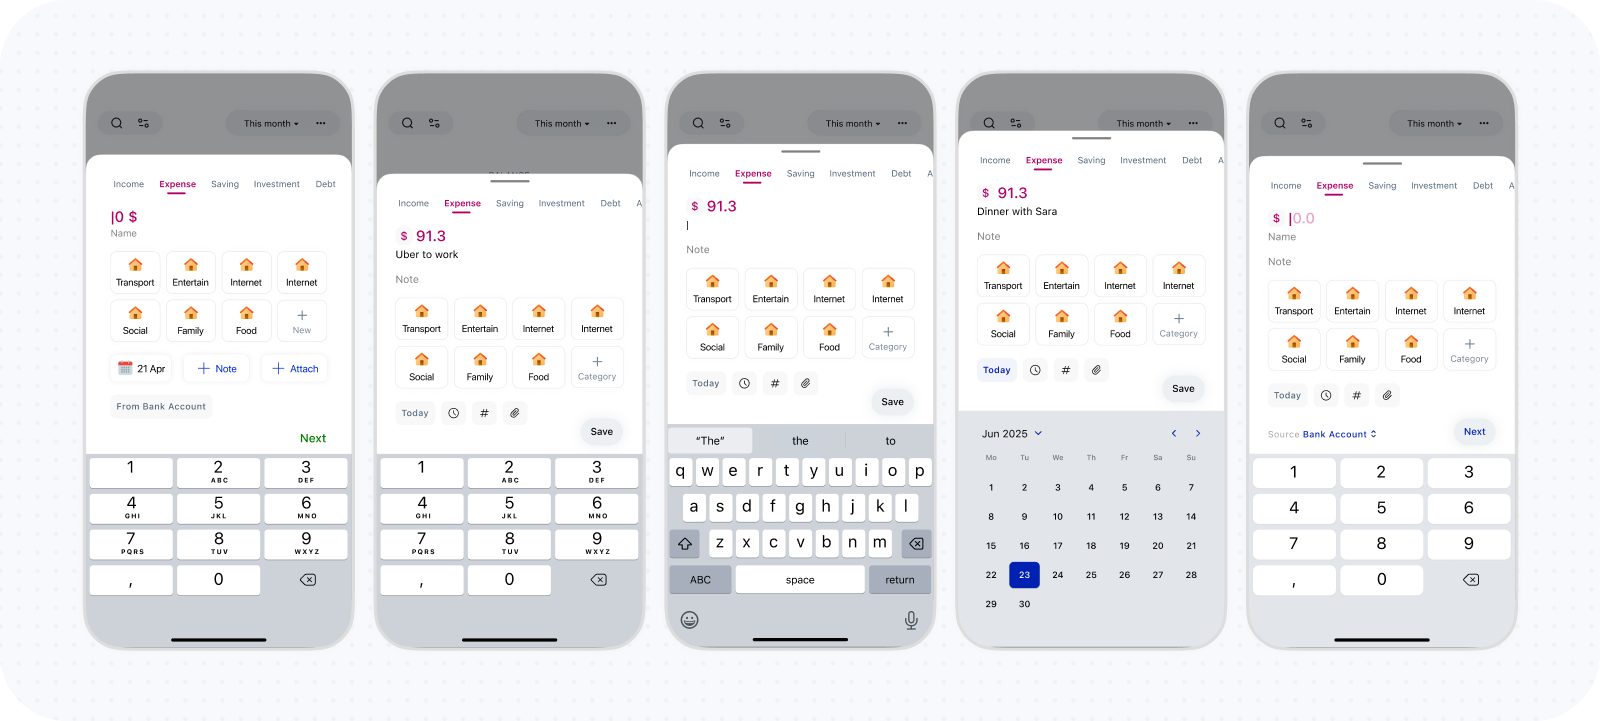
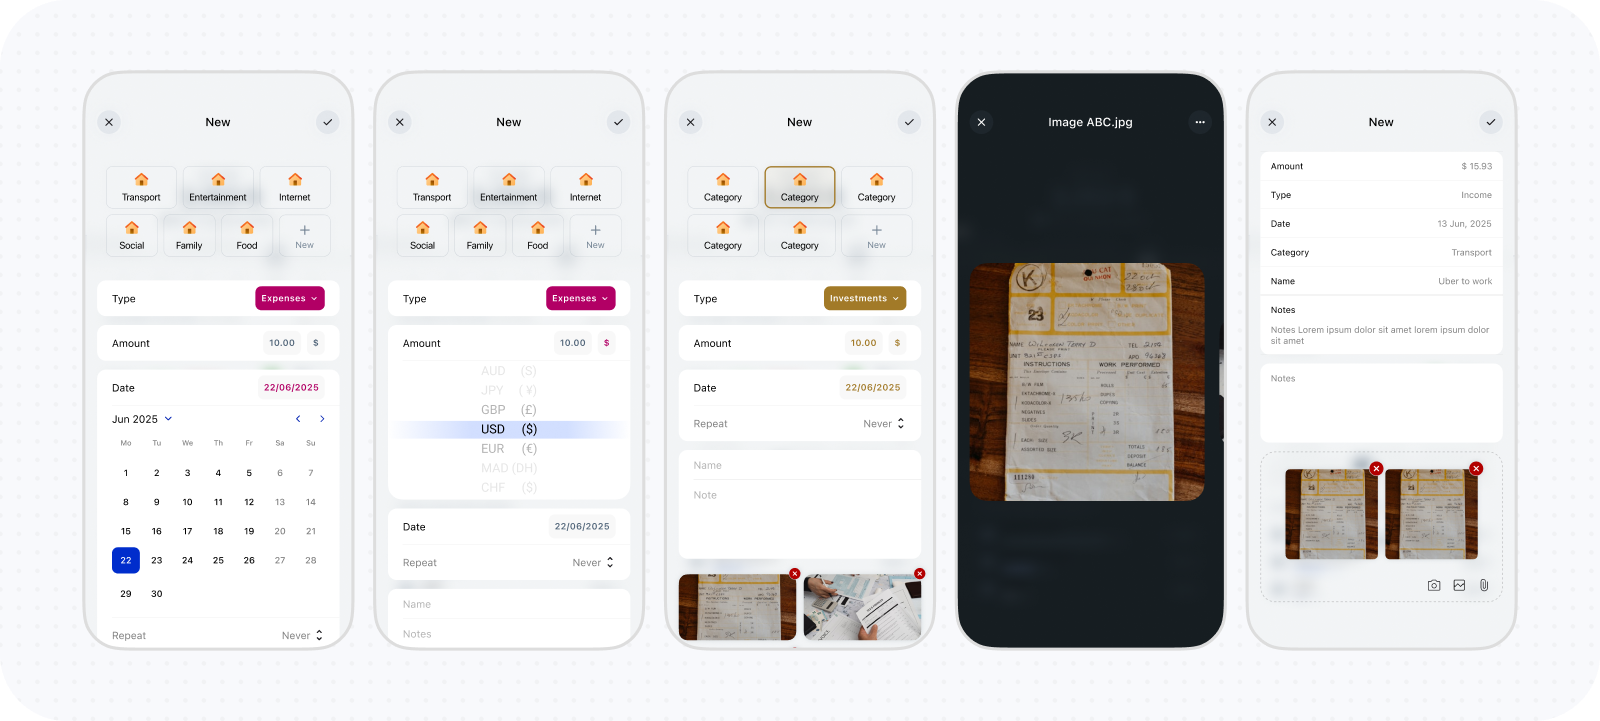
Early versions supported a broad set of properties, including names, notes, tags, receipt attachments, dates, categories, and other metadata. Every addition required another logging control, editing state, detail representation, row indicator, and sometimes another filter. This breadth conflicted with fast capture and made transaction rows compete with the reports around them. I reduced the permanent model to the essentials: amount, category, date, and an optional name that falls back to the category when absent. Less frequent and more advanced properties remain hidden until needed.
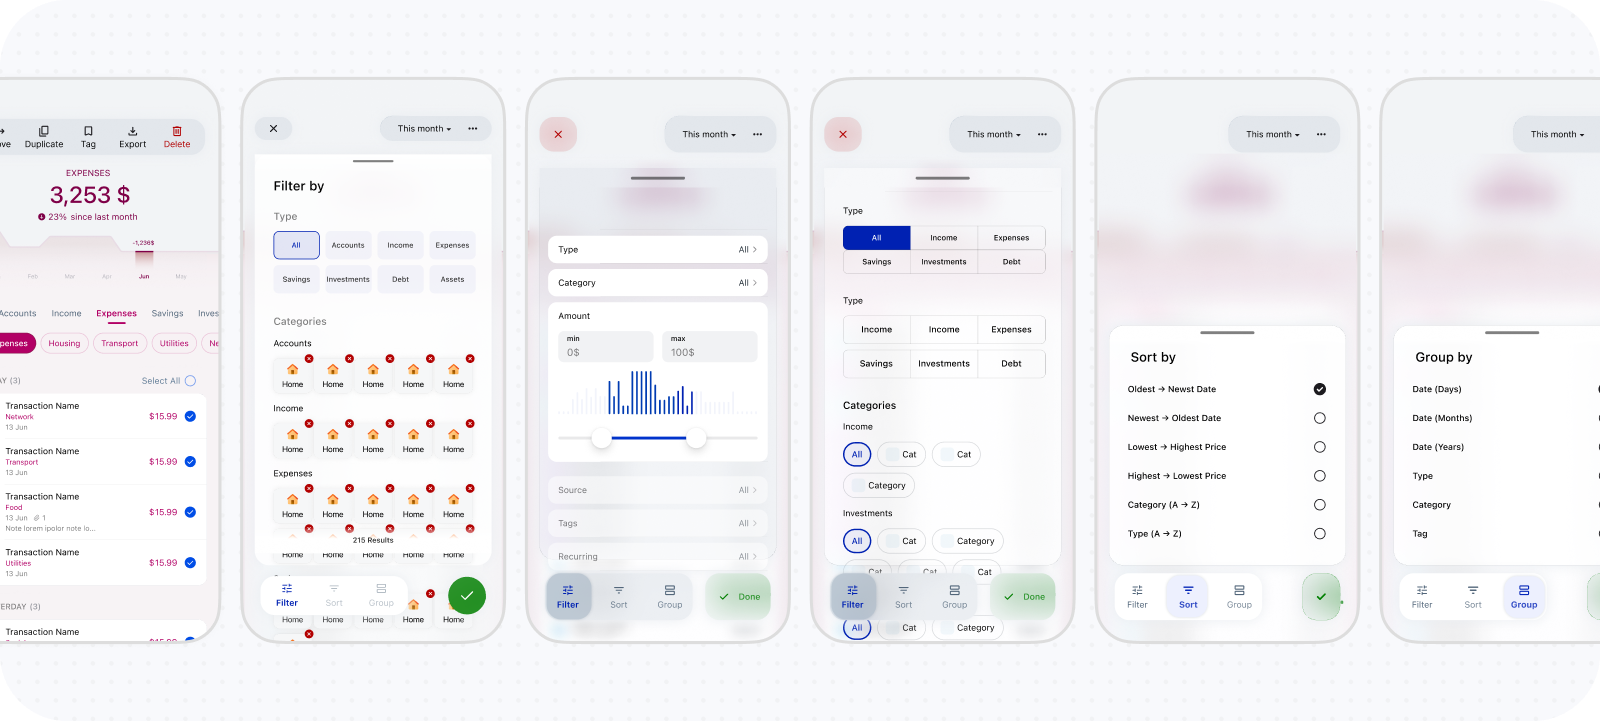
The row followed the same reduction. It needed enough information to identify the transaction and communicate special states without becoming a compressed details screen. Category icons were initially prominent but became redundant once the list moved inside a category report, where category identity was already expressed through the surrounding screen and contribution cards. List controls were narrowed for the same reason. Immediate-child chips preserve hierarchical context, search handles a known record, and a small set of sort and transaction-state controls supports common investigation. Selection, recategorization, and bulk actions appear when the user enters those modes rather than remaining permanently visible.
Prioritizing controls to navigate transactions
The list controls evolved around different reasons for opening transactions. Search helps find a known record, while category chips narrow the current report’s immediate children. Earlier directions added dedicated filtering, sorting, and grouping panels, but their combined control set was too broad for everyday review. The later direction retains a smaller set of sort and transaction-state controls, with selection and bulk actions appearing only when needed.
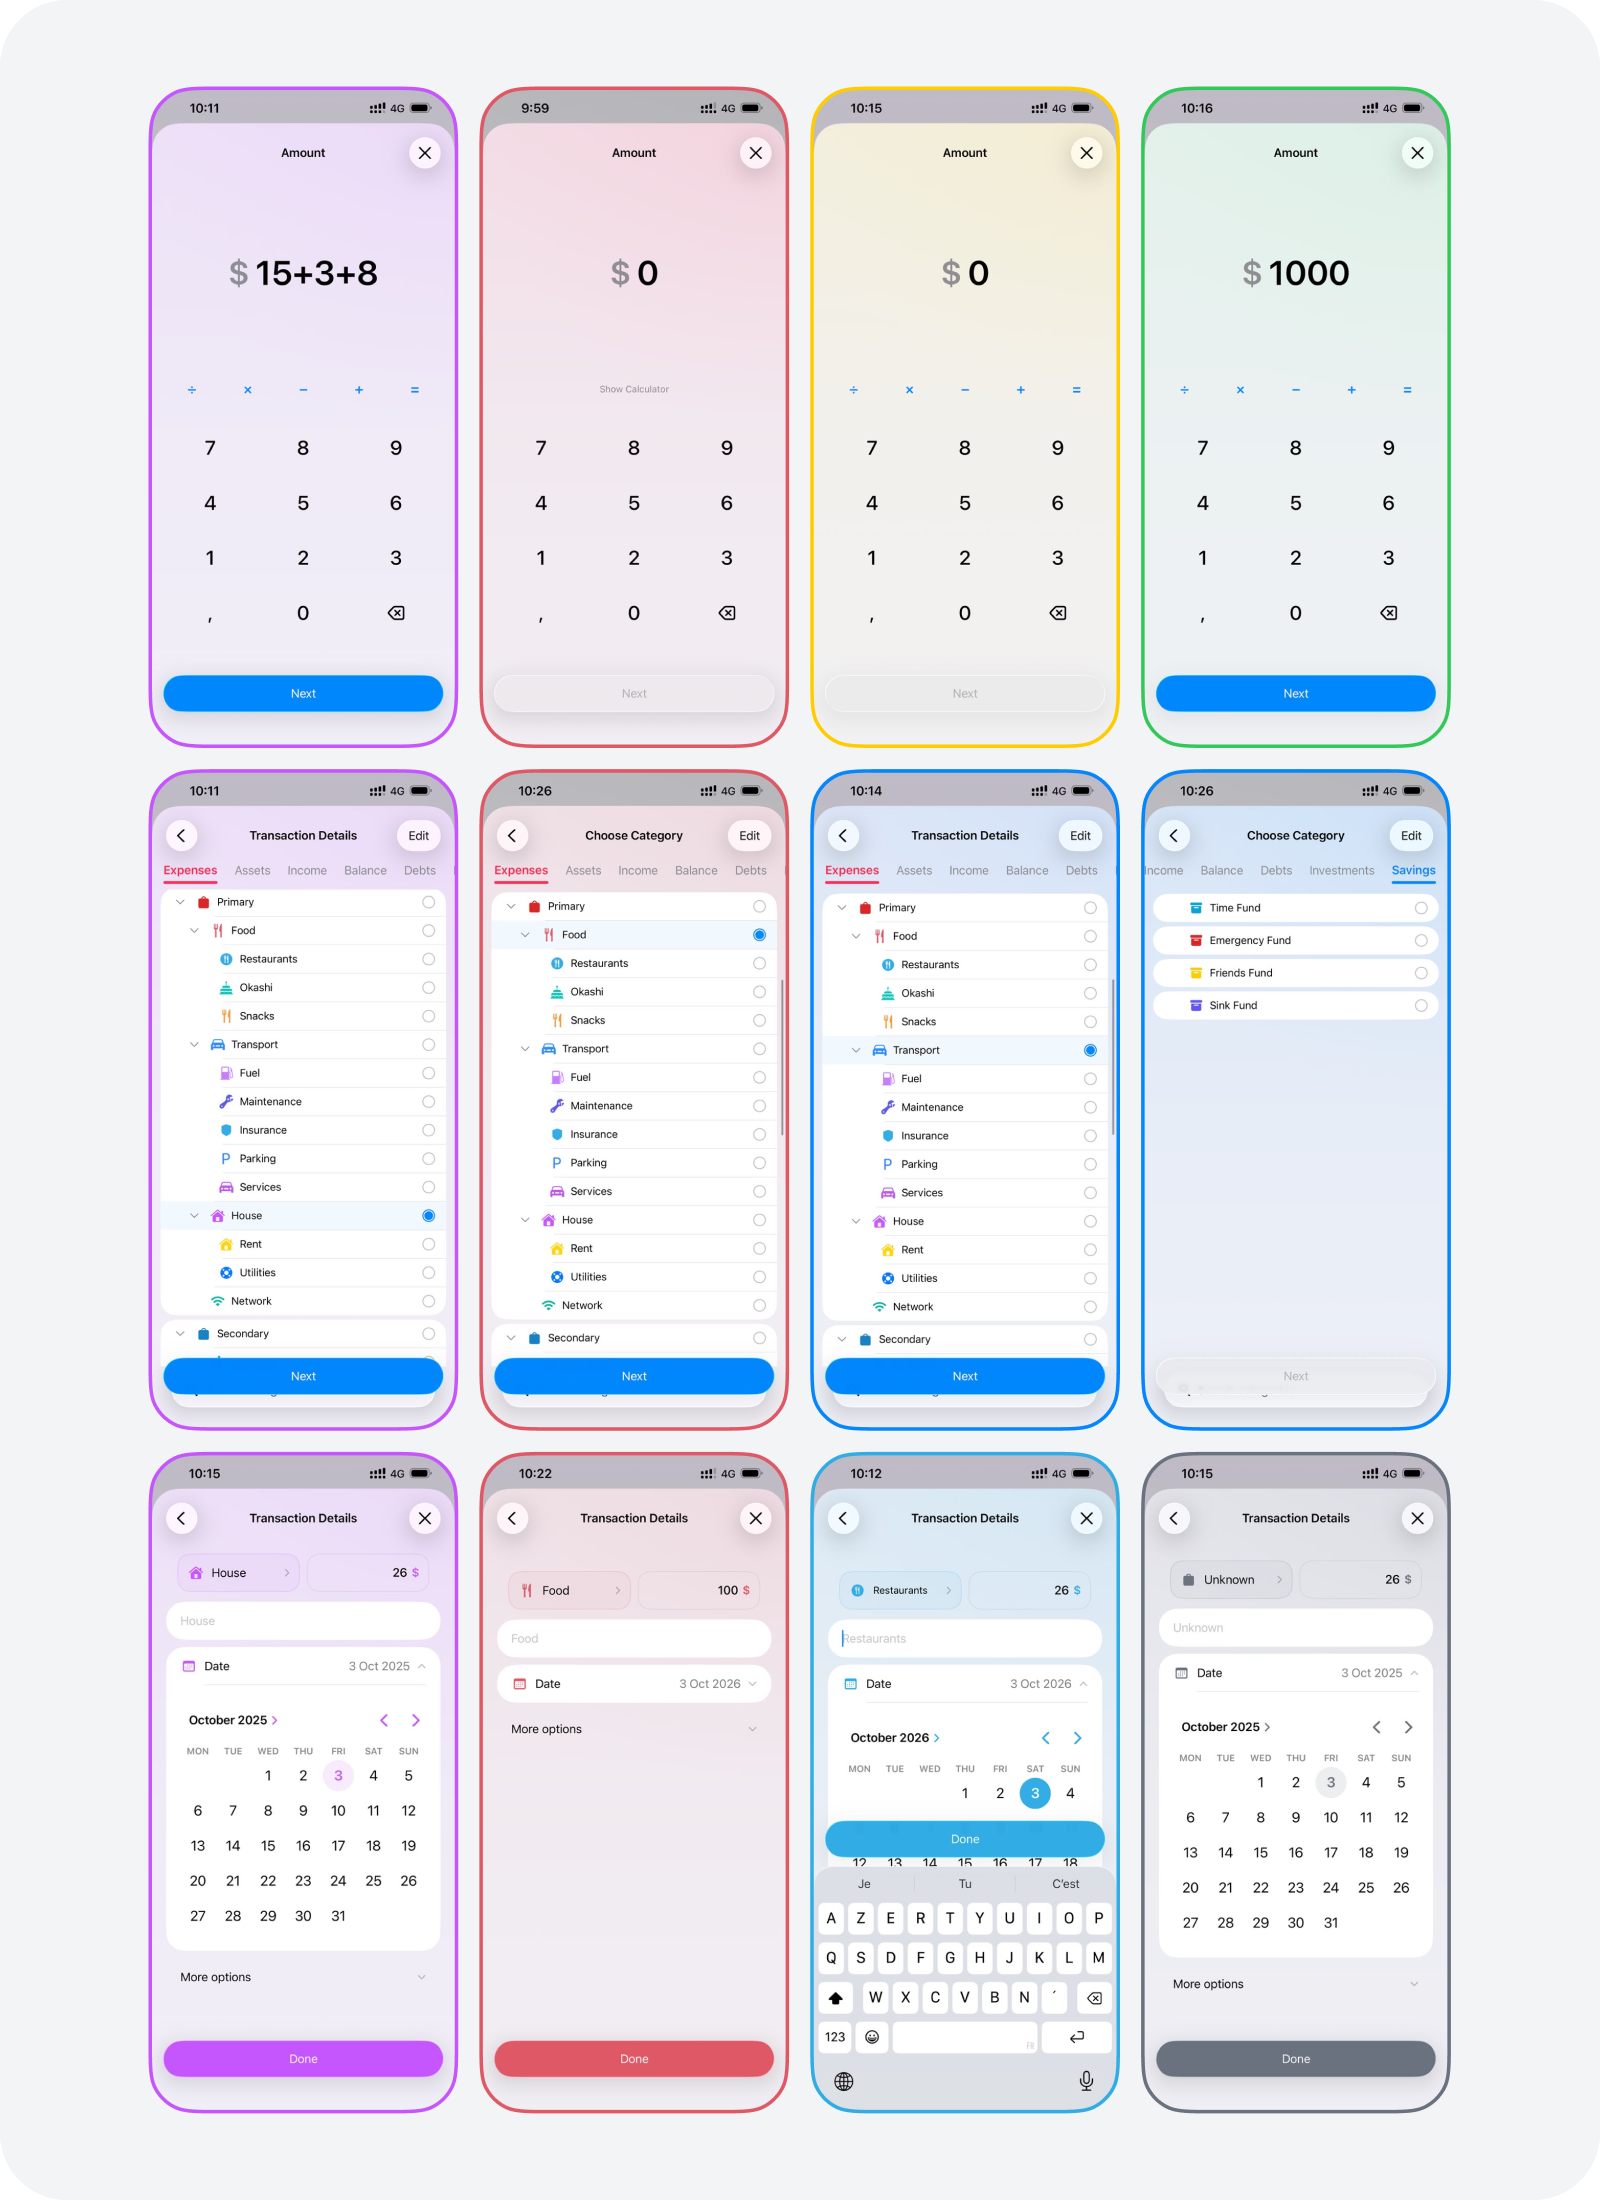
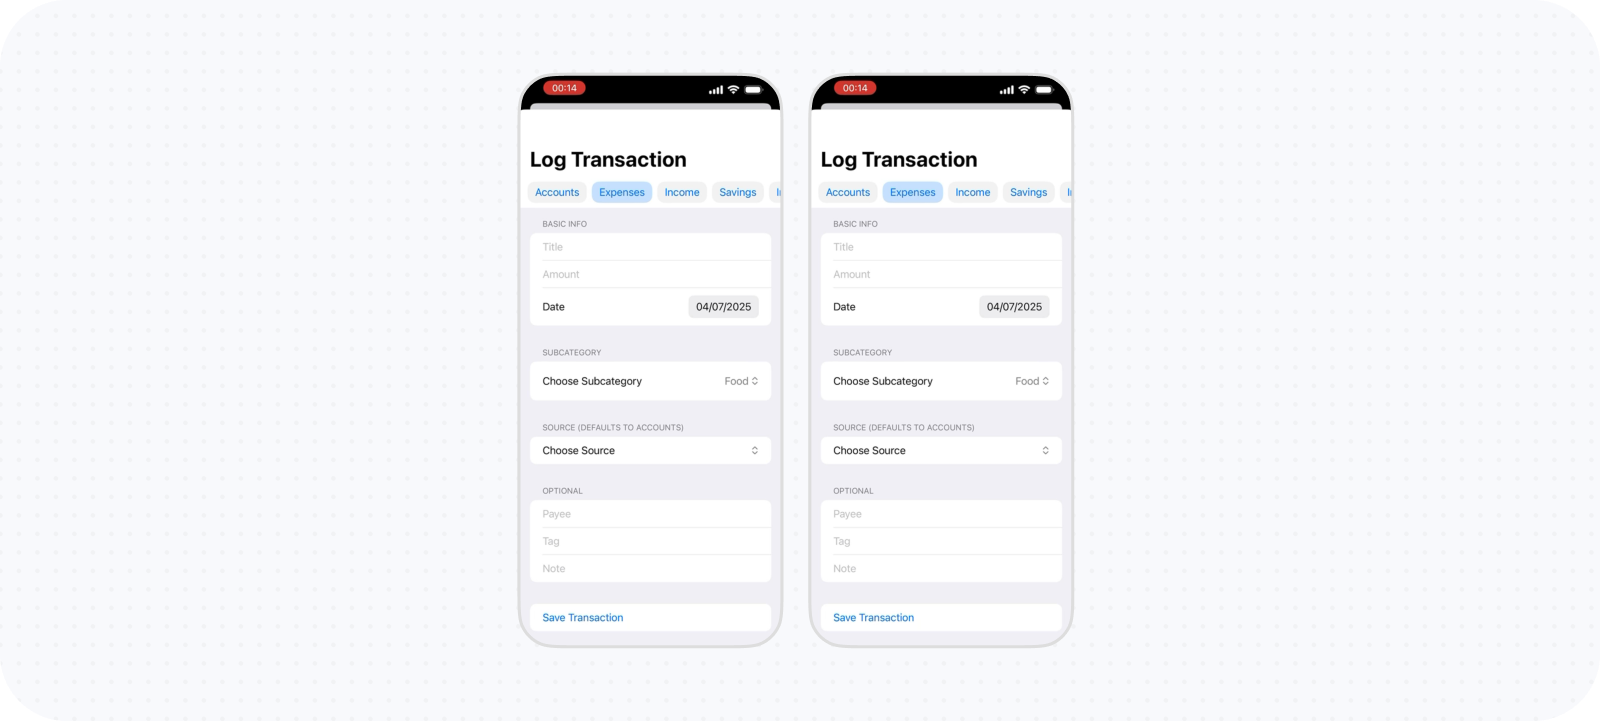
Replacing compact forms with a three-step flow
I avoided a multi-step flow for a long time because more screens appeared less efficient. I explored many compact sheets and minimal forms instead, but they still required repeated movement between unrelated inputs and made category selection and advanced properties compete with the amount. The final flow separates three decisions: amount, category, and confirmation. Amount receives a focused view with the necessary controls and a calculator available when needed. Category selection receives enough space for Kane’s hierarchy and advances immediately after a choice. The final step uses smart defaults, so it often needs no changes, while the name, date, and advanced options remain available for refinement.
Transfers exposed the limits of explicit control. One version always required source and destination categories, supporting cases such as spending directly from savings. In ordinary use, this added clicks and produced technical labels such as Balance → Expenses where the expense category was the meaningful identity. Testing with a friend made that mismatch clearer. I moved common money movement into smart defaults: expenses are funded from Balance and income enters Balance. Source information remains meaningful in Balance contexts, while unusual movement can be represented through explicit or composed transactions. This sacrifices directness for some edge cases but keeps the dominant logging flow understandable.
Reusing one transaction structure for viewing, creating, and editing
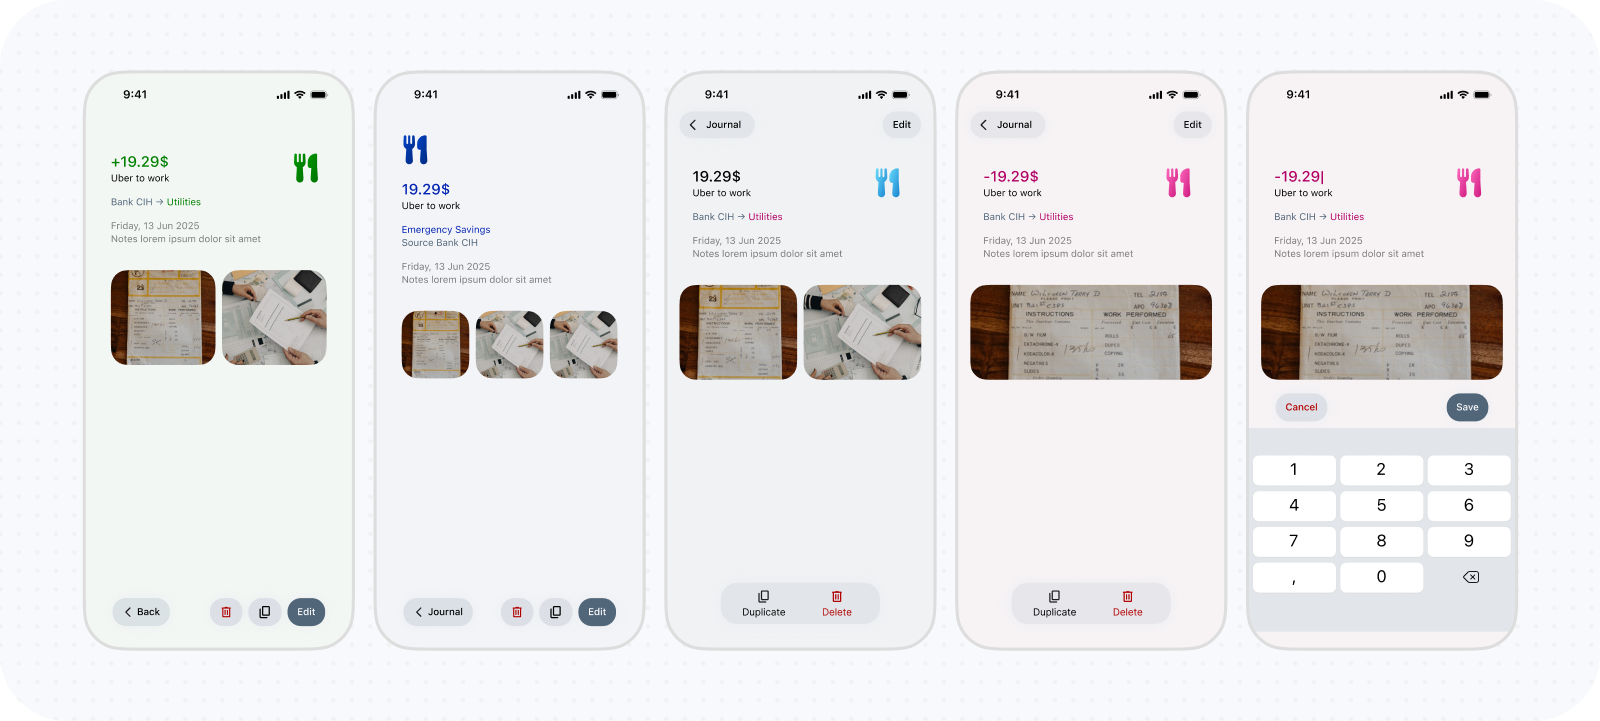
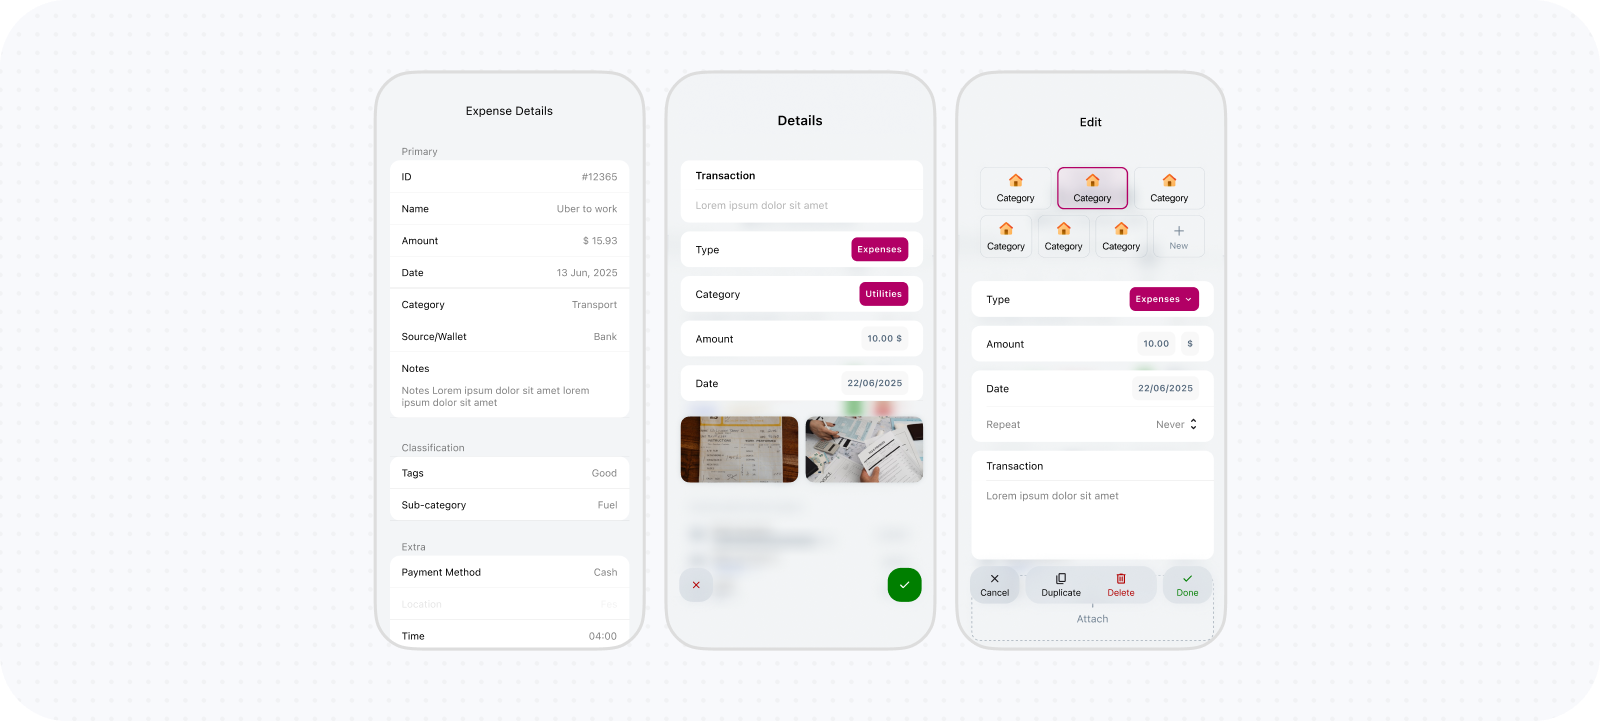
When transactions lived in a separate screen, selecting one navigated to a read-only details page. Editing then required another action and a separate CRUD sheet with a different layout. The sequence preserved a clear safety boundary but created too many transitions for a simple correction. As transactions moved into report cards and list sheets, details also became a sheet so the category and report remained visible behind it. I then reused the final step of the logging flow and made its fields editable by default. A transaction can now be inspected and corrected within the same structure rather than moving between read and edit modes.
The tradeoff is accidental-edit risk. A public product may need a safer hybrid, such as a lightweight edit state, stronger dirty-state feedback, or confirmation only after a value changes. The current implementation also has an unresolved delay of several seconds after Save, which weakens the efficiency this decision was intended to create and still requires investigation.
Design Engineering Categorization Flows
Most finance apps provide a fixed or mostly flat set of categories. Kane lets users define their own financial structure with as much or as little detail as they need. Categorization had to support both maintaining that hierarchy and selecting from it during everyday tasks.
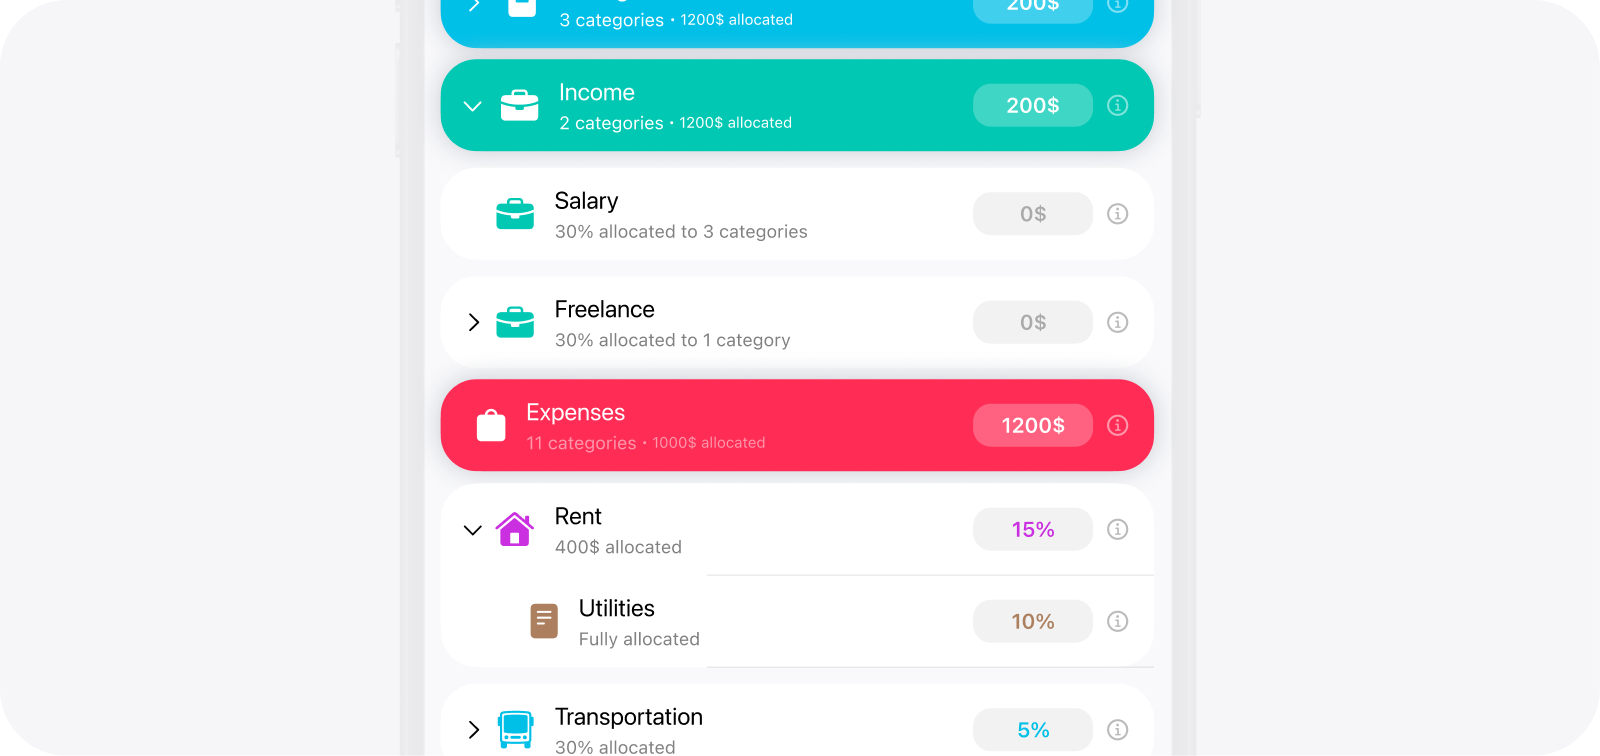
Expandable parent and child rows make the financial hierarchy visible while preserving access to each category.
Replacing Category Drill-Down with One Recursive Tree
The first direction treated categories like a conventional settings hierarchy. The entry showed immediate children, and selecting one navigated to a page containing that category’s details and subcategories. This supported unlimited depth and gave every category a clear home, but it was too slow for a task repeated during everyday logging. Selecting a deeply nested category could require navigating through several screens and then retracing the path to choose something else. Besides, parent categories created a new ambiguity because tapping one could mean selecting it or navigating into it. I experimented with sibling tabs and other shortcuts, but they reduced only parts of the friction.
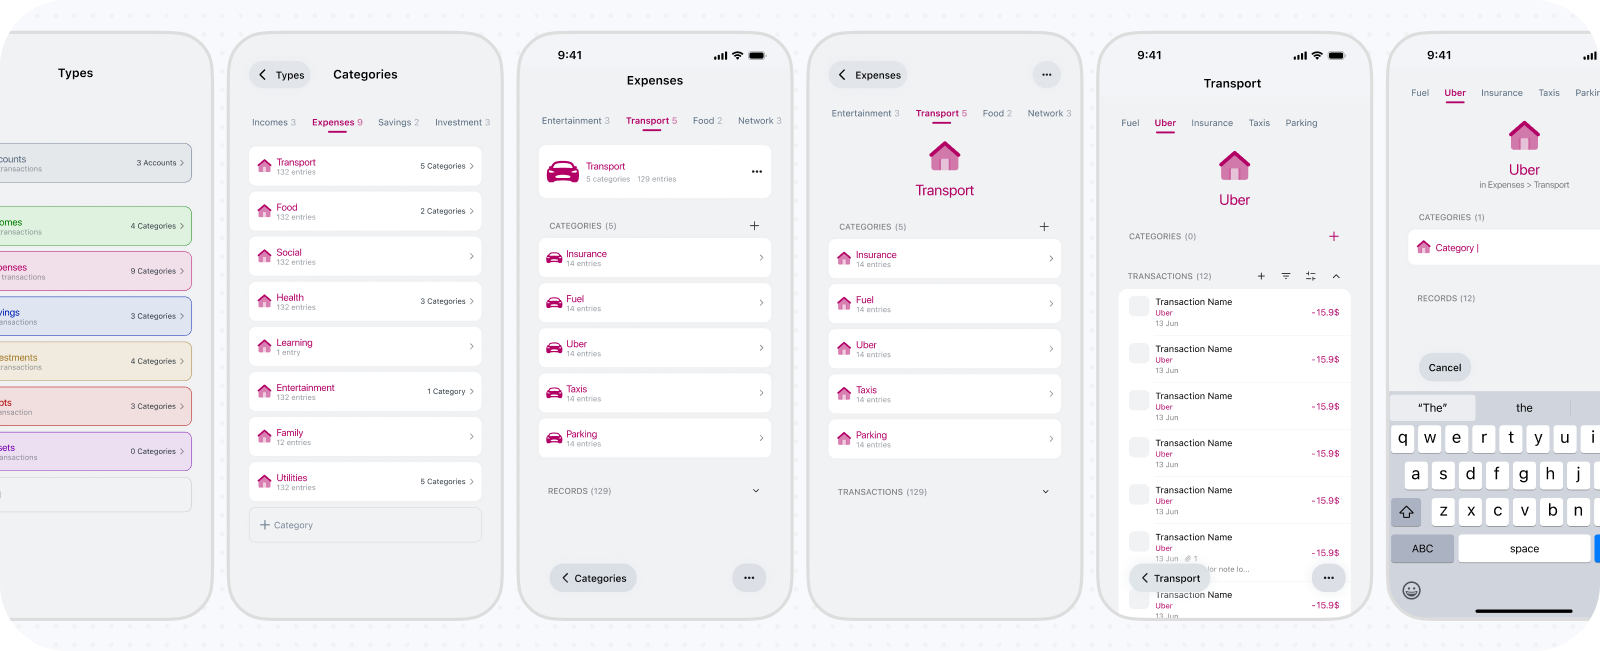
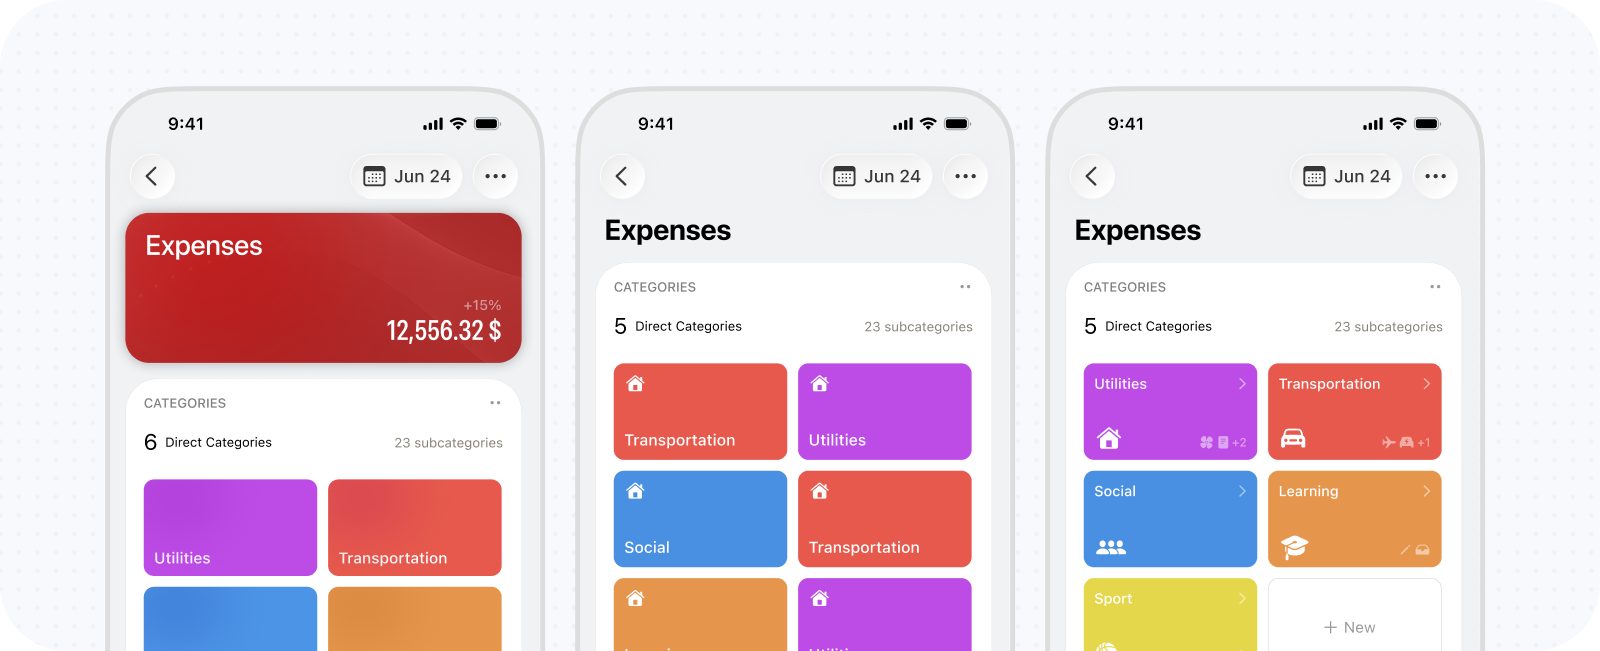
I changed the model from navigating through categories to directly itneracting with one recursive tree. Parents and descendants remained visible in the same context, and disclosure controls were used for expansion. A parent could therefore be selected without sacrificing access to its children. The approach emerged while designing budget setup, where assigning amounts across nested categories made repeated drill-downs particularly cumbersome.
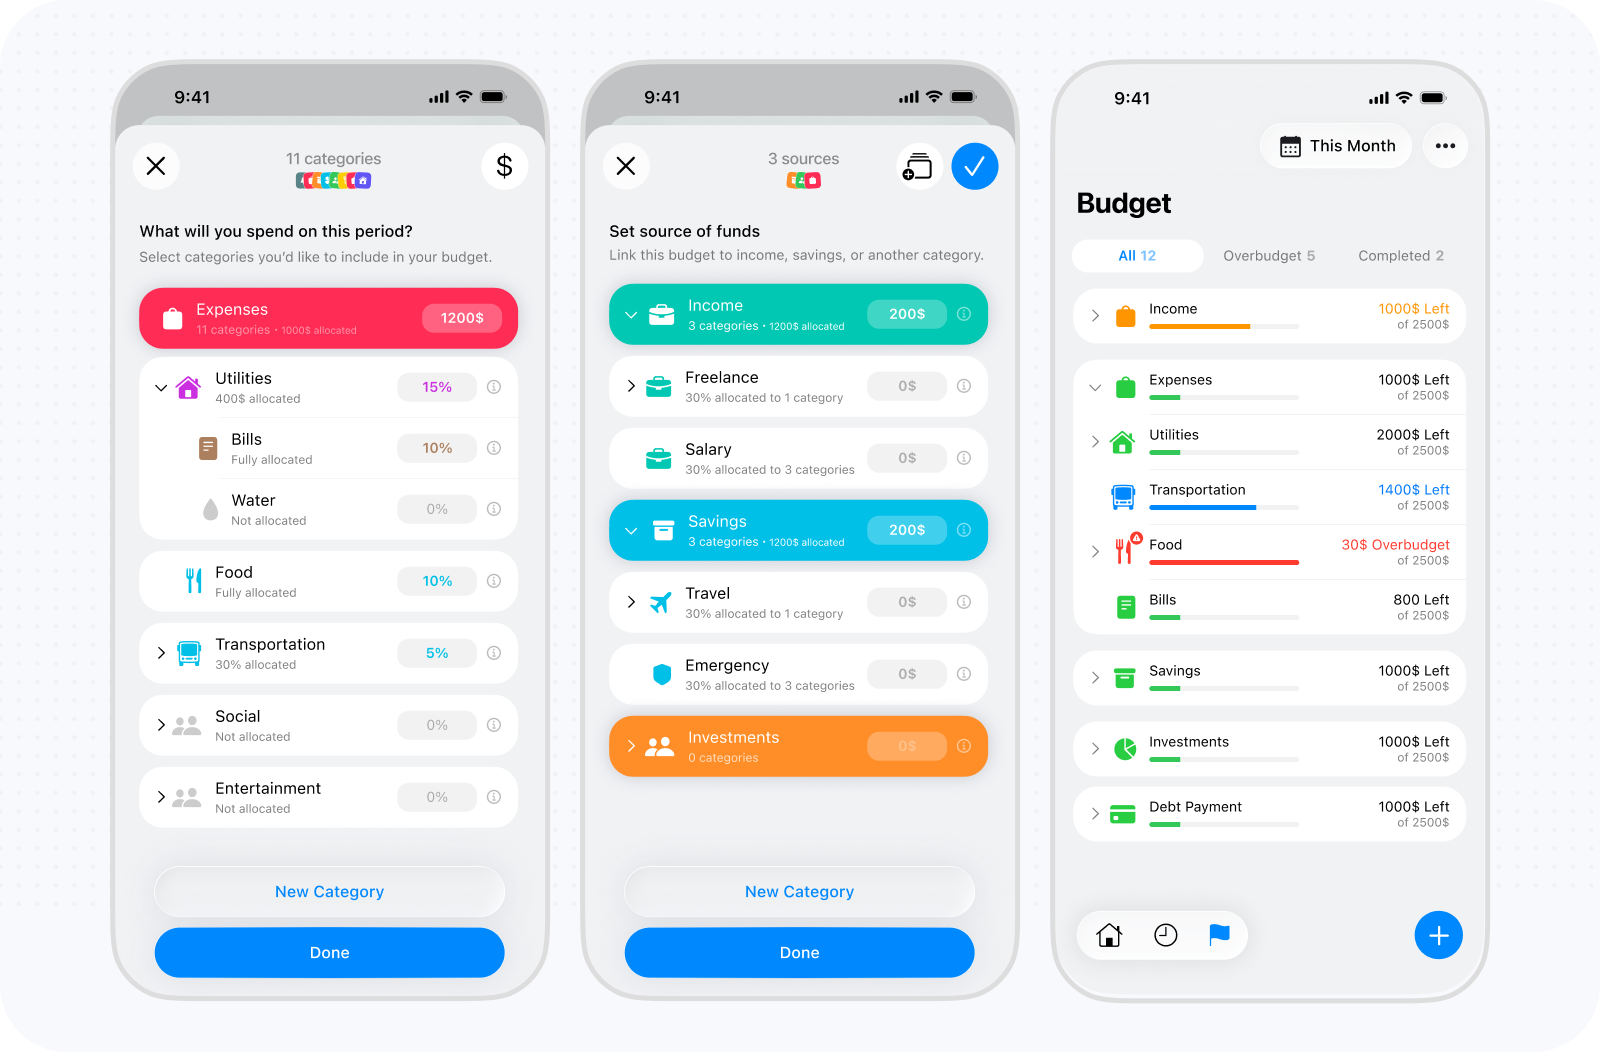
The tree still needed a visual grammar that worked with real data. Highest-level concepts such as Expenses, Income, Balance became horizontal tabs in the constrained logging flow to reduce the working set without limiting the hierarchy. Within each root, indentation communicates depth, space separates major branches, and dividers preserve relationships between nested rows. Branches expand by default for speed, while search provides a direct route through longer structures. Icons and colors reinforce identity, and a radio-style control gives explicit selection feedback. The main tradeoff is density. A recursive tree exposes more information than one simple page at a time, but it dramatically reduces navigation and makes relationships visible. For a structure used repeatedly during transaction capture, that efficiency was more valuable than the apparent simplicity of page-by-page drill-down.
Separating category selection from management
Early versions combined selection and management. Each row needed to select, expand, edit, create a child, and expose additional actions at the same time. The interface became visually busy and the consequence of tapping was difficult to predict. I separated the experience into View and Edit modes while preserving the same hierarchy and scroll context. View mode focuses on choosing a category; Edit mode changes the rows to support editing, adding a child inline, and accessing less frequent actions. Rearranging becomes another temporary state so drag handles do not compete with ordinary controls.
Creating or editing a category opens a focused, expressive sheet with a live preview, name, color palette, custom color, and searchable icon library. New children inherit sensible visual cues from their parent while remaining customizable. The inline plus beside each category is not the quietest or most self-explanatory control, but restricting it to Edit mode provides a practical balance between fast nested creation and everyday clarity.
Management became particularly valuable because my financial priorities do not stay fixed. New categories emerge, an old distinction becomes irrelevant, or I begin thinking about part of my finances differently. I can create a new branch, rename a category, move it beneath another parent, or reorder siblings without recreating its transactions. Because categories retain stable identities, Kane’s reports immediately reflect the reorganized hierarchy and my current way of understanding the same financial history. Real use also revealed an important difference between an obsolete category and an incorrect one. Hiding removes a category from normal selection while preserving its transactions and historical meaning. Edit mode can reveal hidden categories, communicates their state, and allows them to be restored. Deletion remains available but uses protective rules. Transactions move to the deleted category’s parent—or to Other when necessary—while its children are reparented rather than silently removed. Core system roots are locked. Together, hiding, moving, and guarded deletion let the taxonomy evolve without making historical data fragile.
Preserving one category structure across contexts
Categories are managed deliberately but selected constantly, so one presentation could not suit every context. Building separate category systems for each flow, however, would teach users multiple versions of the same hierarchy and allow their behavior to diverge. I built one shared category browser that adapts to its entry point. Settings provides a permanent destination for deliberate maintenance. Transaction logging embeds it as a step inside the existing wizard, preserving momentum instead of opening another unrelated sheet. Recategorization and other tasks can present it contextually, while editing from a report opens directly on the current category and allows the user to return to the complete hierarchy. Each surface changes its container and initial state, not the underlying model. Expansion, indentation, visual identity, visibility rules, and management behavior remain consistent. This reuse matters beyond implementation efficiency: once users understand categories in one place, the same logic applies when they log, investigate, filter, or reorganize their finances.
It also closes the loop between structure and insight. Selecting a category assigns a transaction to that point in the hierarchy; opening its report aggregates the appropriate descendants; moving the category changes where those transactions contribute. The category manager, transaction picker, and reporting architecture are therefore different views of one system rather than loosely connected features. The result is not merely a category picker, but rather a shared navigation and classification model that keeps Kane simple for someone using broad categories while allowing progressively greater precision whenever it becomes useful.
Design Engineering AI Copilot & MCP
Kane already had a rich financial model: user-defined categories, flexible reporting periods, transaction history, budgets, goals, and future scenarios. The copilot needed to make that system easier to explore through conversation while preserving the app’s accuracy, context, and user control. I designed Kane AI as an integrated product experience: a persistent place to ask questions, connected to Kane’s financial data and workflows, with clear boundaries around what it knows and what it can do. The work is still evolving, including an MCP integration now in progress.
Integrating the copilot into Kane's navigation
The first architectural question was where the copilot belonged within Kane. I tried different entry points and settled on Kane AI beside the main navigation on Summary: visible from the primary financial overview, but not competing with core reporting and transaction tasks. Alternative placements are still being tested. Opening the copilot entry point takes over the app as a full-screen experience. A smaller sheet would preserve more of the underlying screen but constrain long answers, result cards, dictation, and conversation history. The full-screen overlay gives the copilot room to work while retaining the current app state underneath. Kane’s floating navigation hides while chat is open; Close returns to the same place. The copilot reopens the last active conversation. Its sidebar brings together recent chats, search, New Chat, rename/archive, and AI settings; archived conversations remain recoverable for seven days. This history model suits my own use, though its prominence may change as I learn more about how others use the copilot. Starter prompts introduce useful tasks, while the composer rotates through examples about spending, savings, trends, budgets, and goals. After a conversation starts, its placeholder becomes quiet. Together, these cues explain what the copilot can do without a long command list.

Refining the chat interface across interaction states
The chat interface needed to support both quick questions and detailed financial scenarios without letting its controls dominate the conversation. The composer stays compact for short messages, grows as the user writes, and can expand into a dedicated editor when a question needs more space. Its actions also adapt to the task: typing exposes Send, dictation introduces recording controls, and an ongoing response can be stopped from the same area.
Keeping that input area accessible also meant protecting the space needed to read. User messages sit in restrained bubbles, while longer assistant answers use an open layout with clear paragraph and list spacing. Copy and feedback actions remain attached to each response. The floating header and composer were refined around keyboard visibility and scrolling, with a return-to-latest control so users can revisit earlier messages and then resume the conversation.

Separating language interpretation from financial calculation
Questions such as “Can I afford this?” depend on the user’s categories, reporting periods, balances, and assumptions about the future. A language model answering directly from raw financial data would overload the model's context window, increase token use, risk calculation errors, and make financial numbers difficult to verify against Kane, so I separated language understanding from financial calculation. The assistant interprets the request and selects a supported Kane capability. The current Kane-specific reporting bridge retrieves reports, comparisons, category breakdowns, transactions, budgets, goals, income, cash flow, savings, and liquidity using the app’s canonical financial logic. Future questions (i.e., when a user wants to forecast their future financial position based on current behavior, etc.) use a deterministic scenario planner. AI translates a request into inputs such as a target, recurring contribution, purchase, or income change; Kane calculates the projected balance, time to target, or shortfall. Actual ledger values, historical context, remembered preferences, and hypothetical assumptions remain distinct, so a projection is not presented as a guaranteed outcome.
Kane’s unlimited category hierarchy and flexible periods require careful interpretation. The same category name can appear in different branches, so Kane resolves full paths and asks a focused clarification when needed. Period expressions map to precise ranges, and follow-ups retain clear category and period context so “What about the month before?” continues the investigation without repeating the query. MCP integration is in progress.
Activity visibility, memory, and action approval
A useful financial answer needs more than a confident tone. Users should see when Kane is reviewing records or calculating a plan, inspect assumptions, and decide before anything changes. During a request, Kane shows meaningful progress (e.g., reviewing records, checking memory, calculating, or applying guidance, etc.) instead of a generic typing indicator. Users can stop a response; failures explain the issue, reassure them that data is safe, and offer Retry. Completed activity collapses into a summary that can be expanded to inspect relevant details and assumptions. The trace remains with the conversation without exposing implementation labels. Everyday questions receive concise prose; explicit requests for a report, comparison, or breakdown add structured cards with category, period, metrics, and whether values come from the ledger or a hypothetical plan. Unsolicited charts are avoided so AI visuals do not conflict with Kane’s reporting system. Amount hiding applies throughout AI, and response feedback lets users mark answers helpful or inaccurate.
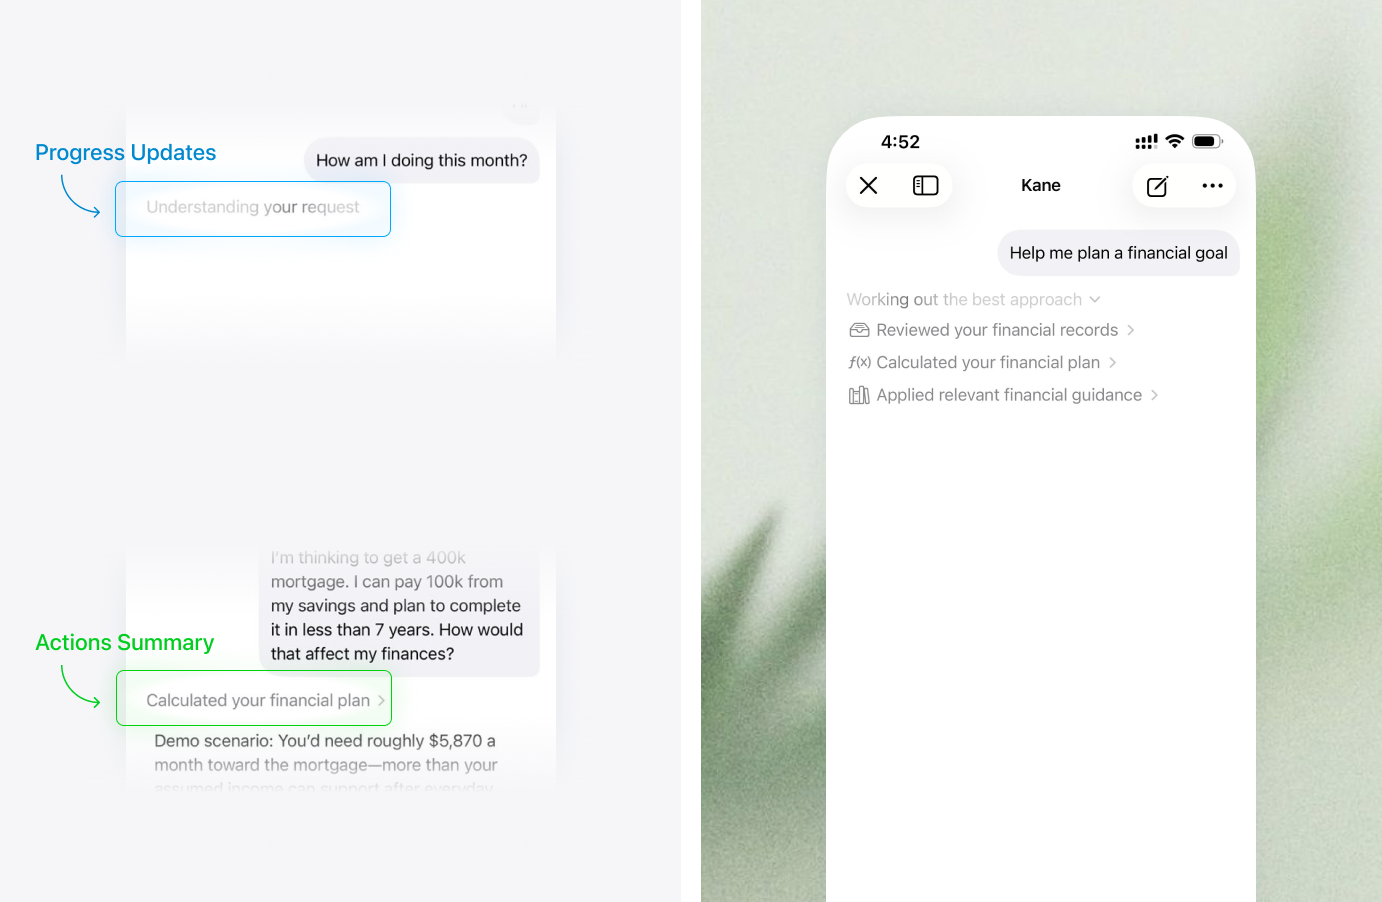
Besides, memory is separated by scope: relevant preferences and goals can carry across chats, while scenario assumptions stay within their conversation. Users can disable memory, inspect or remove details, and manage a dated financial timeline. The live ledger remains authoritative for current values. Privacy settings explain what is sent for a request and what stays on device. When the assistant proposes a transaction, it shows the title, amount, category, and date in a review card. The user must explicitly save or cancel; the assistant does not silently write to the ledger. This establishes an interaction pattern that can extend to future actions with controls suited to their risk. I built a Quality Lab to make these expectations testable across accuracy, planning, tools, memory, conversation, experience, and privacy. Repeatable checks cover ambiguous categories, scenario isolation, memory correction, and requests to guess. It supports iteration but does not replace broader user research. Two areas remain open: memory can currently be saved quietly and reviewed afterward, and transaction creation is the only supported write action. Both will need further design as the copilot expands.
Other Flows Currently Taking Shape
The core of Kane now connects transaction capture, category-based reporting, and financial history. I’m extending that foundation toward a fuller view of someone’s financial life: what they owe, what they own, how their position may change, and how they can bring their existing financial accounts into the picture. These experiences are at different stages. The dedicated debt, investment, forecasting, and onboarding flows are still being designed and refined; the boards shown here are explorations, not shipped product. Report export and sharing are implemented. I’m documenting this work as the next chapter of the product rather than presenting unfinished screens as completed outcomes.
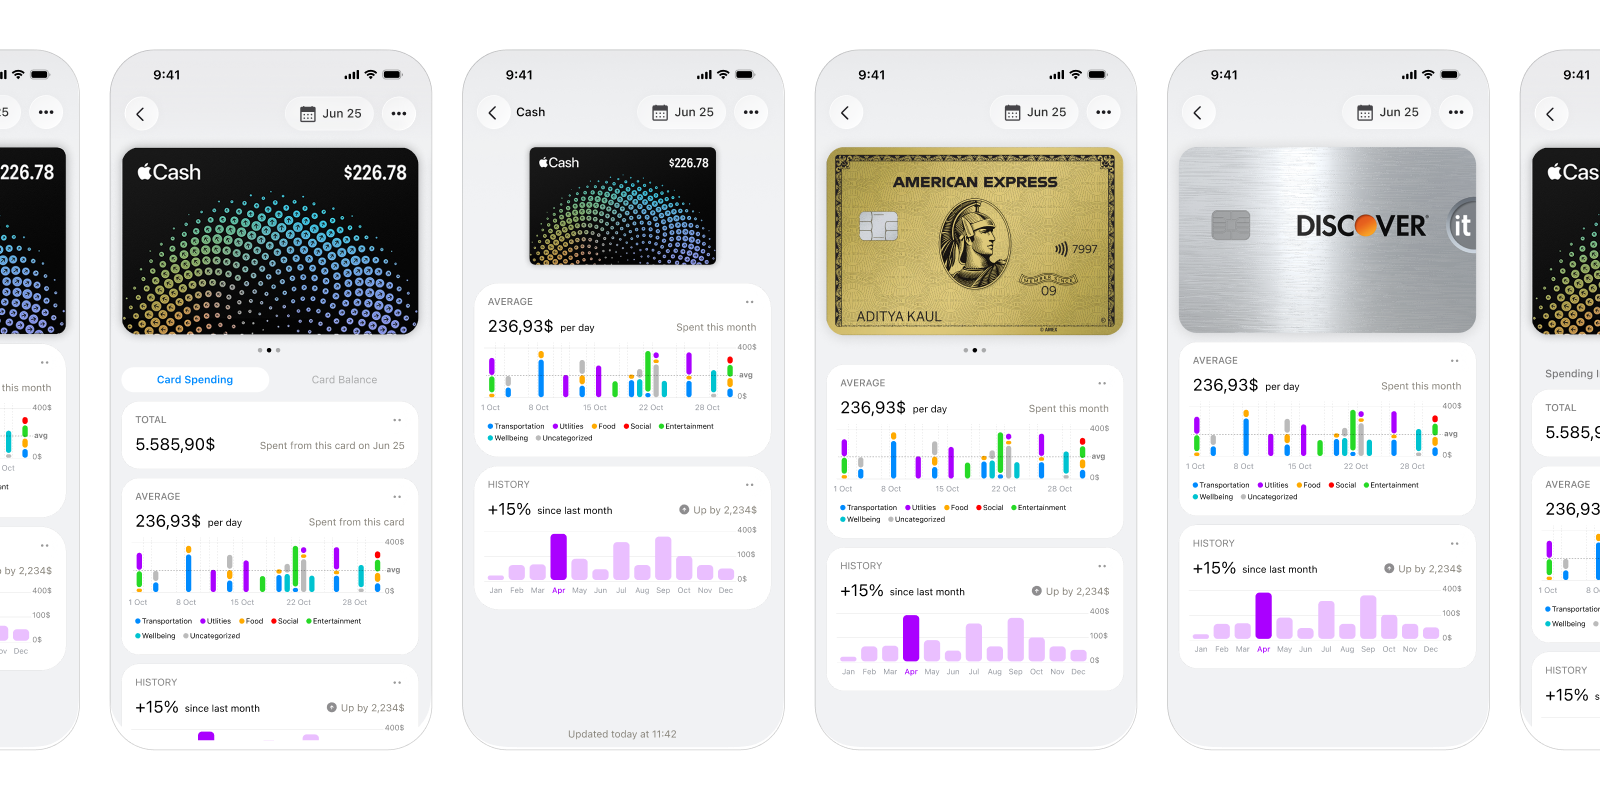
Extending Balance to connected financial accounts
I’m exploring a way to connect Kane with users’ actual financial accounts so that bank accounts and cards can appear inside Balance. The designs show account or card identities alongside their balances, transactions, and familiar report cards. This would broaden the meaning of Balance. Instead of relying only on records users enter themselves, Kane could bring connected accounts into the same reporting architecture and help users understand the activity and position across them. The experience raises product questions beyond the connection screen: how to represent different institutions and account types consistently, how connected data relates to Kane’s existing category model, and how to make the source and freshness of information clear. The designs are exploratory; account synchronization is not implemented.
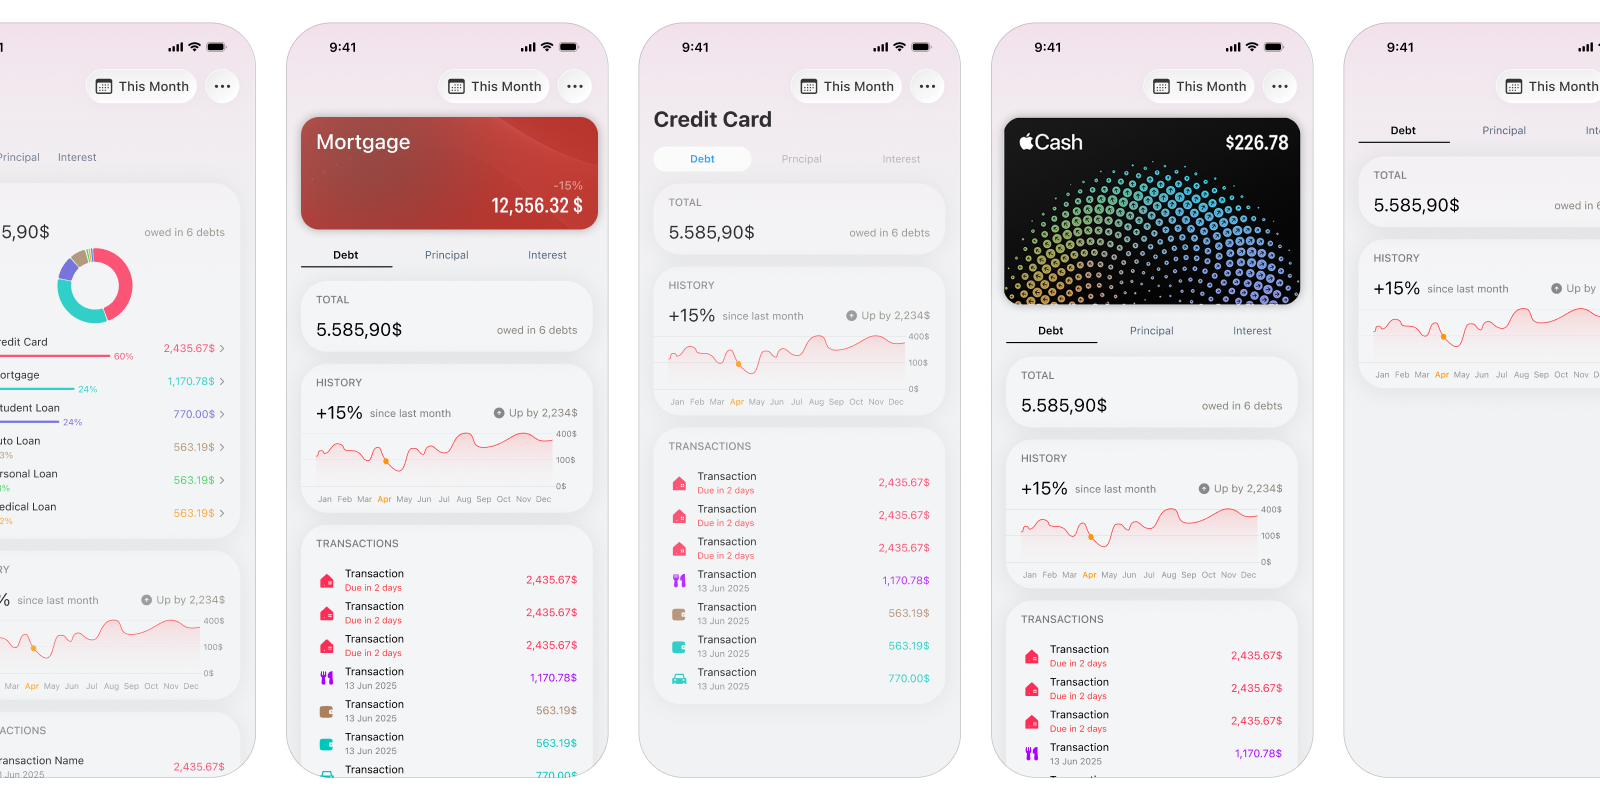
Extending debt reports into repayment planning
The current category model can represent debt and show its balances, activity, and contribution to net worth. The design exploration takes this further: opening Debt would become a focused management experience, with an overview and dedicated views for individual obligations such as credit cards or mortgages. The central design question is how to make the total picture useful without losing the detail that makes each debt actionable. The boards explore summary, history, transactions, and individual debt views, with space for practical questions such as payment timing, minimum payments, interest, payoff duration, and repayment planning. The intended experience connects “what do I owe?” with “what happens if I change how I pay?” while keeping each obligation understandable in the broader financial picture.
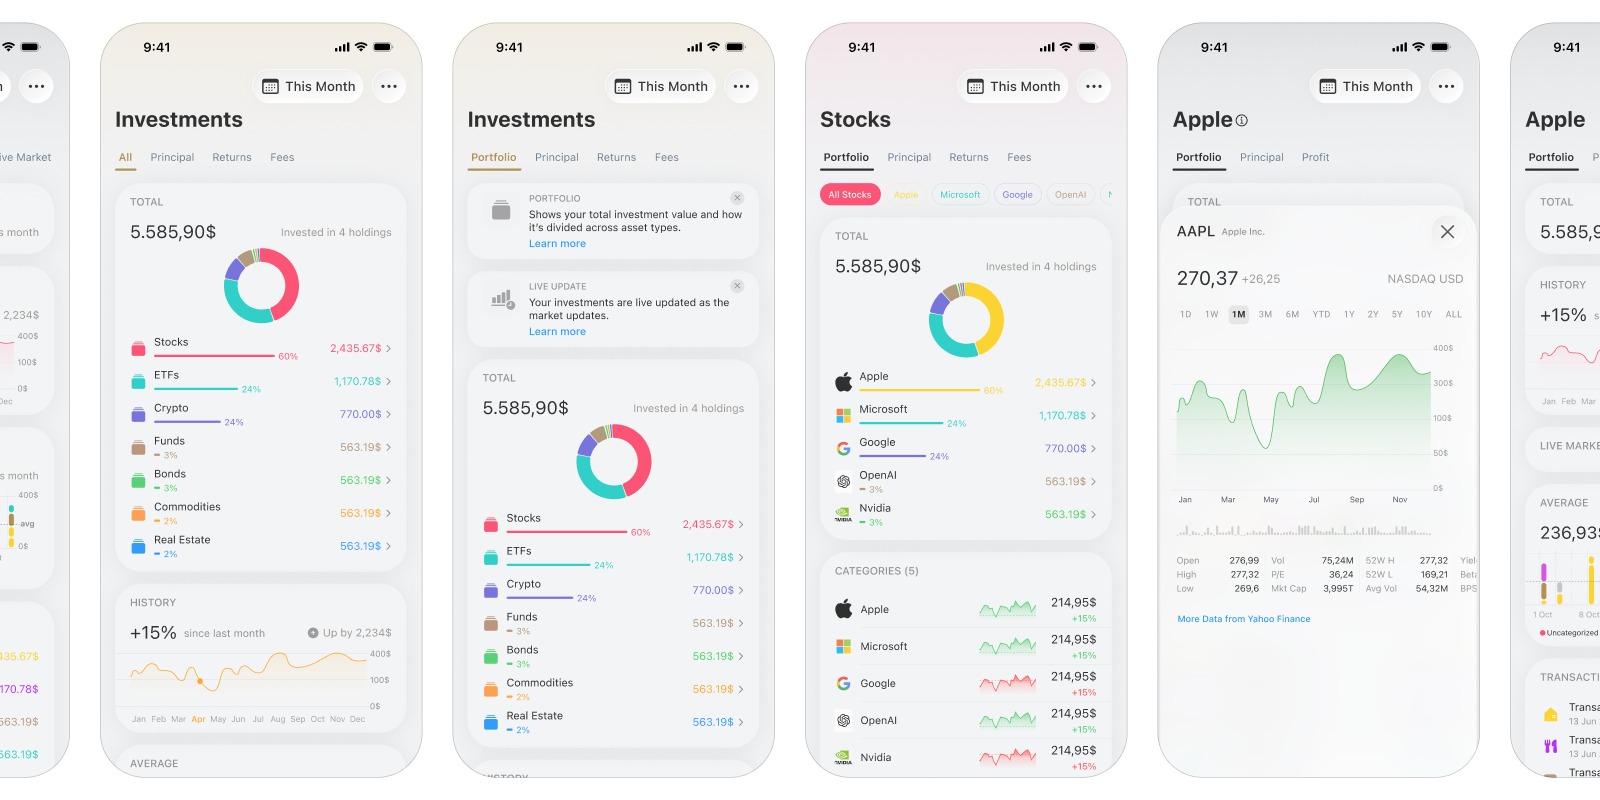
Connecting portfolio performance with individual holdings
The investment designs extend the Investments category from a high-level report into a portfolio experience. They explore moving between a portfolio overview, asset groups such as stocks, and an individual holding, with allocation, history, activity, and performance shown at different levels. The key design challenge is keeping those levels connected: portfolio-level changes should be understandable, while a user can still inspect what is driving them. The boards show repeated iterations across summary cards, charts, holdings lists, and stock detail. These are still design explorations; the dedicated management flow has not been built.
Connecting adjustable assumptions to financial projections
Kane already has a deterministic scenario calculator for questions involving future balances, savings goals, purchases, recurring changes, and debt payoff. I’m still shaping how that capability should become a clear forecasting experience in the app: what users choose as a starting point, which assumptions they can adjust, and how the resulting trajectory should be explained. The design challenge is to make a projection useful without presenting it as a promise. A forecast needs to show the time horizon and inputs behind the result, distinguish actual history from assumed future events, and help users compare possible outcomes. The standalone experience remains in progress, even though the underlying calculation capability exists.
Choosing an onboarding approach with limited testing
Kane’s flexibility creates an onboarding challenge: users can begin with a simple financial setup, then add detail as their priorities change. Onboarding should help someone understand the core model and reach a useful first result without requiring them to configure every category, account, report, or advanced flow at the start. I’m still working through that experience. The key design decision is how much structure to establish up front, what can be inferred or safely defaulted, and when to explain that categories and reports can evolve with the user. The onboarding flow remains exploratory; no approach has been finalized.
